Mighty Insights™ gives you powerful tools to analyze and understand your Network’s activity across multiple dashboards. With interactive charts and detailed metrics, you can uncover how your members engage with your content, Spaces, and each other—helping you make smarter decisions to grow your community.Documentation Index
Fetch the complete documentation index at: https://docs.mightynetworks.com/llms.txt
Use this file to discover all available pages before exploring further.
Key Details About Mighty Insights™
- Desktop Access Only: Mighty Insights™ is available exclusively on desktop web.
- Data Timing: Metrics are updated on a 24-hour delay and reflect data as of the previous day (GMT/UTC time).
- Paid Plans Only: Mighty Insights™ is available on all paid plans. If you’re on a Free Trial of the Growth Plan, you won’t have access to this feature.
Important Notes About Mighty Insights™ Metrics
- Hosts Are Excluded from Most Metrics: Mighty Insights™ primarily focuses on data from Moderators and Members, excluding Network Hosts from many metrics. For instance:
- The “Total Members” count in Mighty Insights™ does not include Hosts.
- Certain charts, like the “Course Interactions” chart, also exclude interactions by Hosts.
- However, some fields, such as the Host and Member Engagement Table and Total Contributions, track data from both Hosts and Members.
- For Full Member Counts, Use the Member List: The Member List (including its downloadable version) provides a complete count of both Hosts and Members. Click “Select All” to see your full member count.
- Data Updates Every 24 Hours: Mighty Insights™ updates every 24 hours, so metrics may lag compared to real-time data available in the Member List or elsewhere in your Network.
- Using the Glossary for Clarity: To confirm whether specific metrics include Hosts, refer to the “Glossary” tab within Mighty Insights™ for detailed definitions.
- Why Your Data Might Seem Higher or Lower Than Expected: Metrics in Mighty Insights™ may appear differently than anticipated due to:
- The exclusion of Hosts from many metrics.
- The 24-hour delay in data updates within Mighty Insights™.
Getting Started
Access Mighty Insights by clicking Network Admin (gear icon) near your profile picture in the top-right corner > Mighty Insights.
- Launch Plan and up:
- Network Hosts: Access to all Mighty Insights.
- Network moderators: Access to all Mighty Insights except the Plans tab and the Income Details tab.
Helpful Tips
- “i” tooltip: Hover the i icon on any chart for in-product explanations.

- Insights on desktop web: Insights are available on desktop web only (not in the Mighty Networks app right now).
- Download Dashboards:
- Download each dashboard in PDF or CSV in the three dot menus

- You can download specific charts and tables in PNG (image), TXT, Excel, CSV, JSON, HTML, or Markdown.
- Download the Host & Member Engagement table (full list):
- Go to Download data > Advanced download options > Number of rows to include > select Custom and enter a number higher than the number of active members in your selected timeframe > Download.
- Glossary: The Glossary dashboard is always available for quick definitions of terms and concepts used in your Insights.
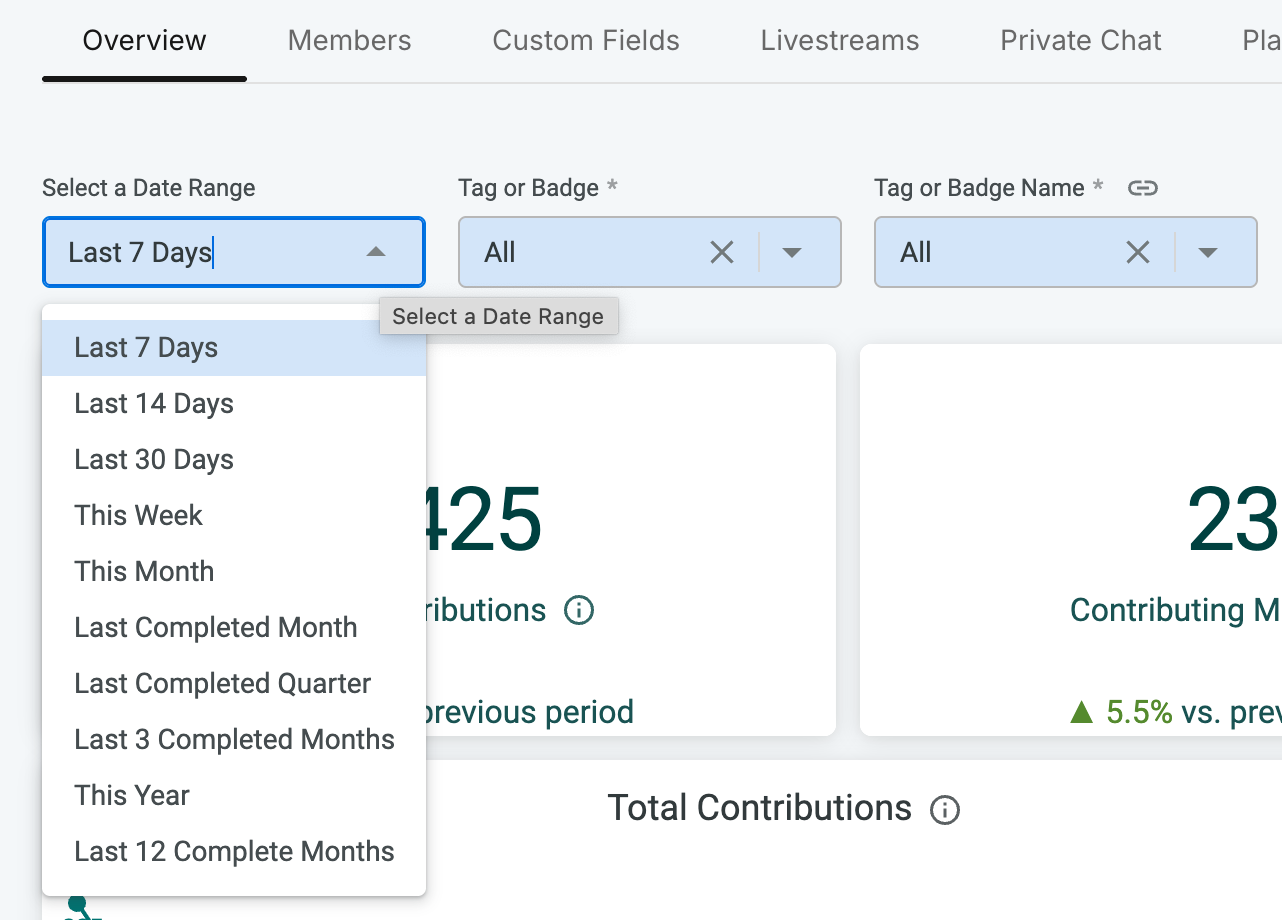
- Change your dashboard timeframe: Adjust the timeframe in the top-left on every dashboard (select a date range, then click Reload on the right).

- Understand “Last 12 Months” vs. “This Year”:
- If your Network is under a year old, This Year shows year-to-date (YTD) data.
- Last 12 Months shows 12 completed months.
- You can view Insights for up to the last 12 months.
Dashboards at a Glance
In Mighty Insights, you have two dashboard groupings:- All Network: dashboards for your entire Mighty Network.
- Space Features: dashboards focused on specific Space features.
All Network
The All Network Dashboard includes the following.- Overview
- Members
- Custom Fields
- Livestreams
- Direct Messages
- Plans
- Income Details
- Ambassadors
- Storage
- Glossary
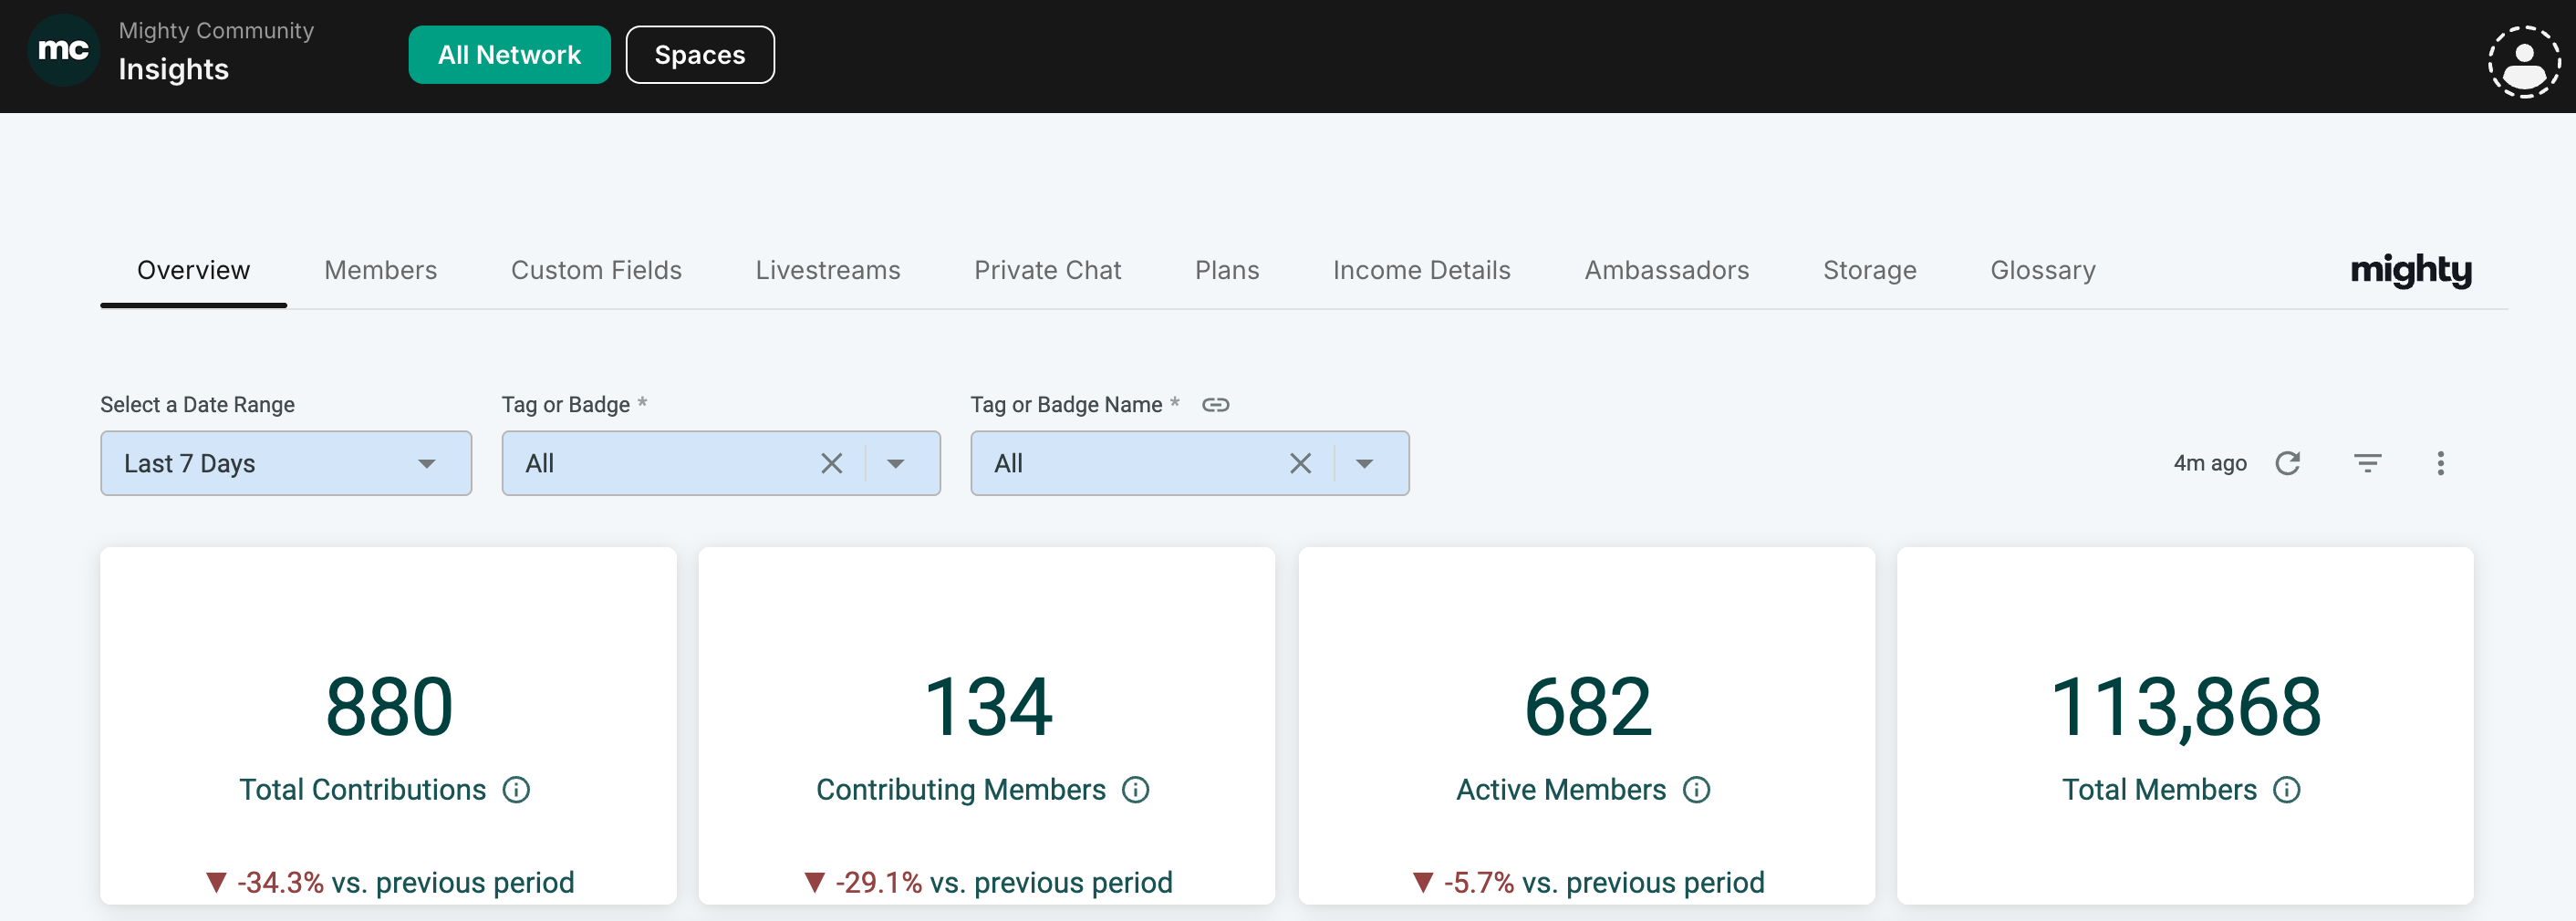
Overview
Your Overview dashboard shows the level of member activity in your Mighty Network at a glance. It includes:- Total Contributions
- Total Contributions are the sum of actions members, moderators, and Hosts take within your network. Contributions include Reactions, Comments, Posts, Shares, Chat Messages, Direct Messages, RSVPs, and more.
- Contributing Members
- Contributing members are members that have made a contribution which includes Reactions, Comments, Posts, Shares, Chat Messages, Direct Messages, RSVPs, and more.
- Active Members
- Active members are the total number of members that visit during the selected time period.
- Total Members
- Total members in your Mighty Network
Members
The Members tab shows how many members are active (visited your Network during the selected day/week/month) and how many are contributing (took an action such as clicking on a post, posting, reacting, RSVPing, voting, or commenting). Metrics and charts: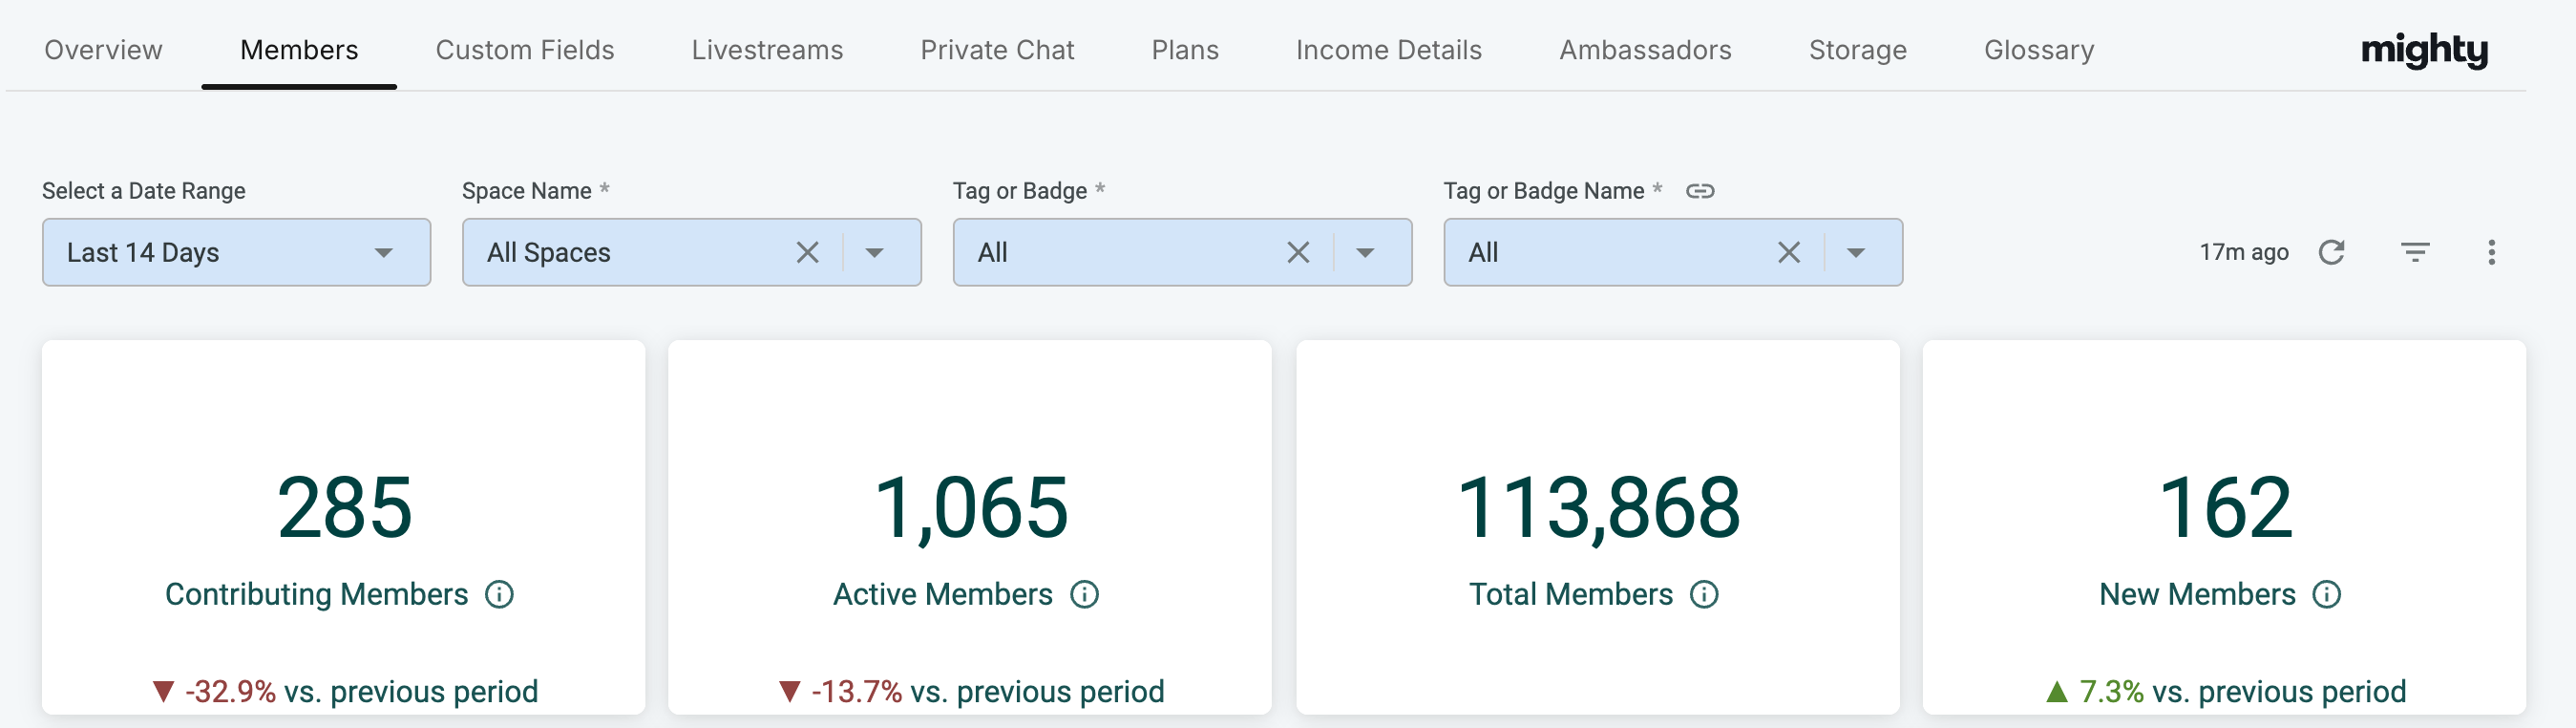
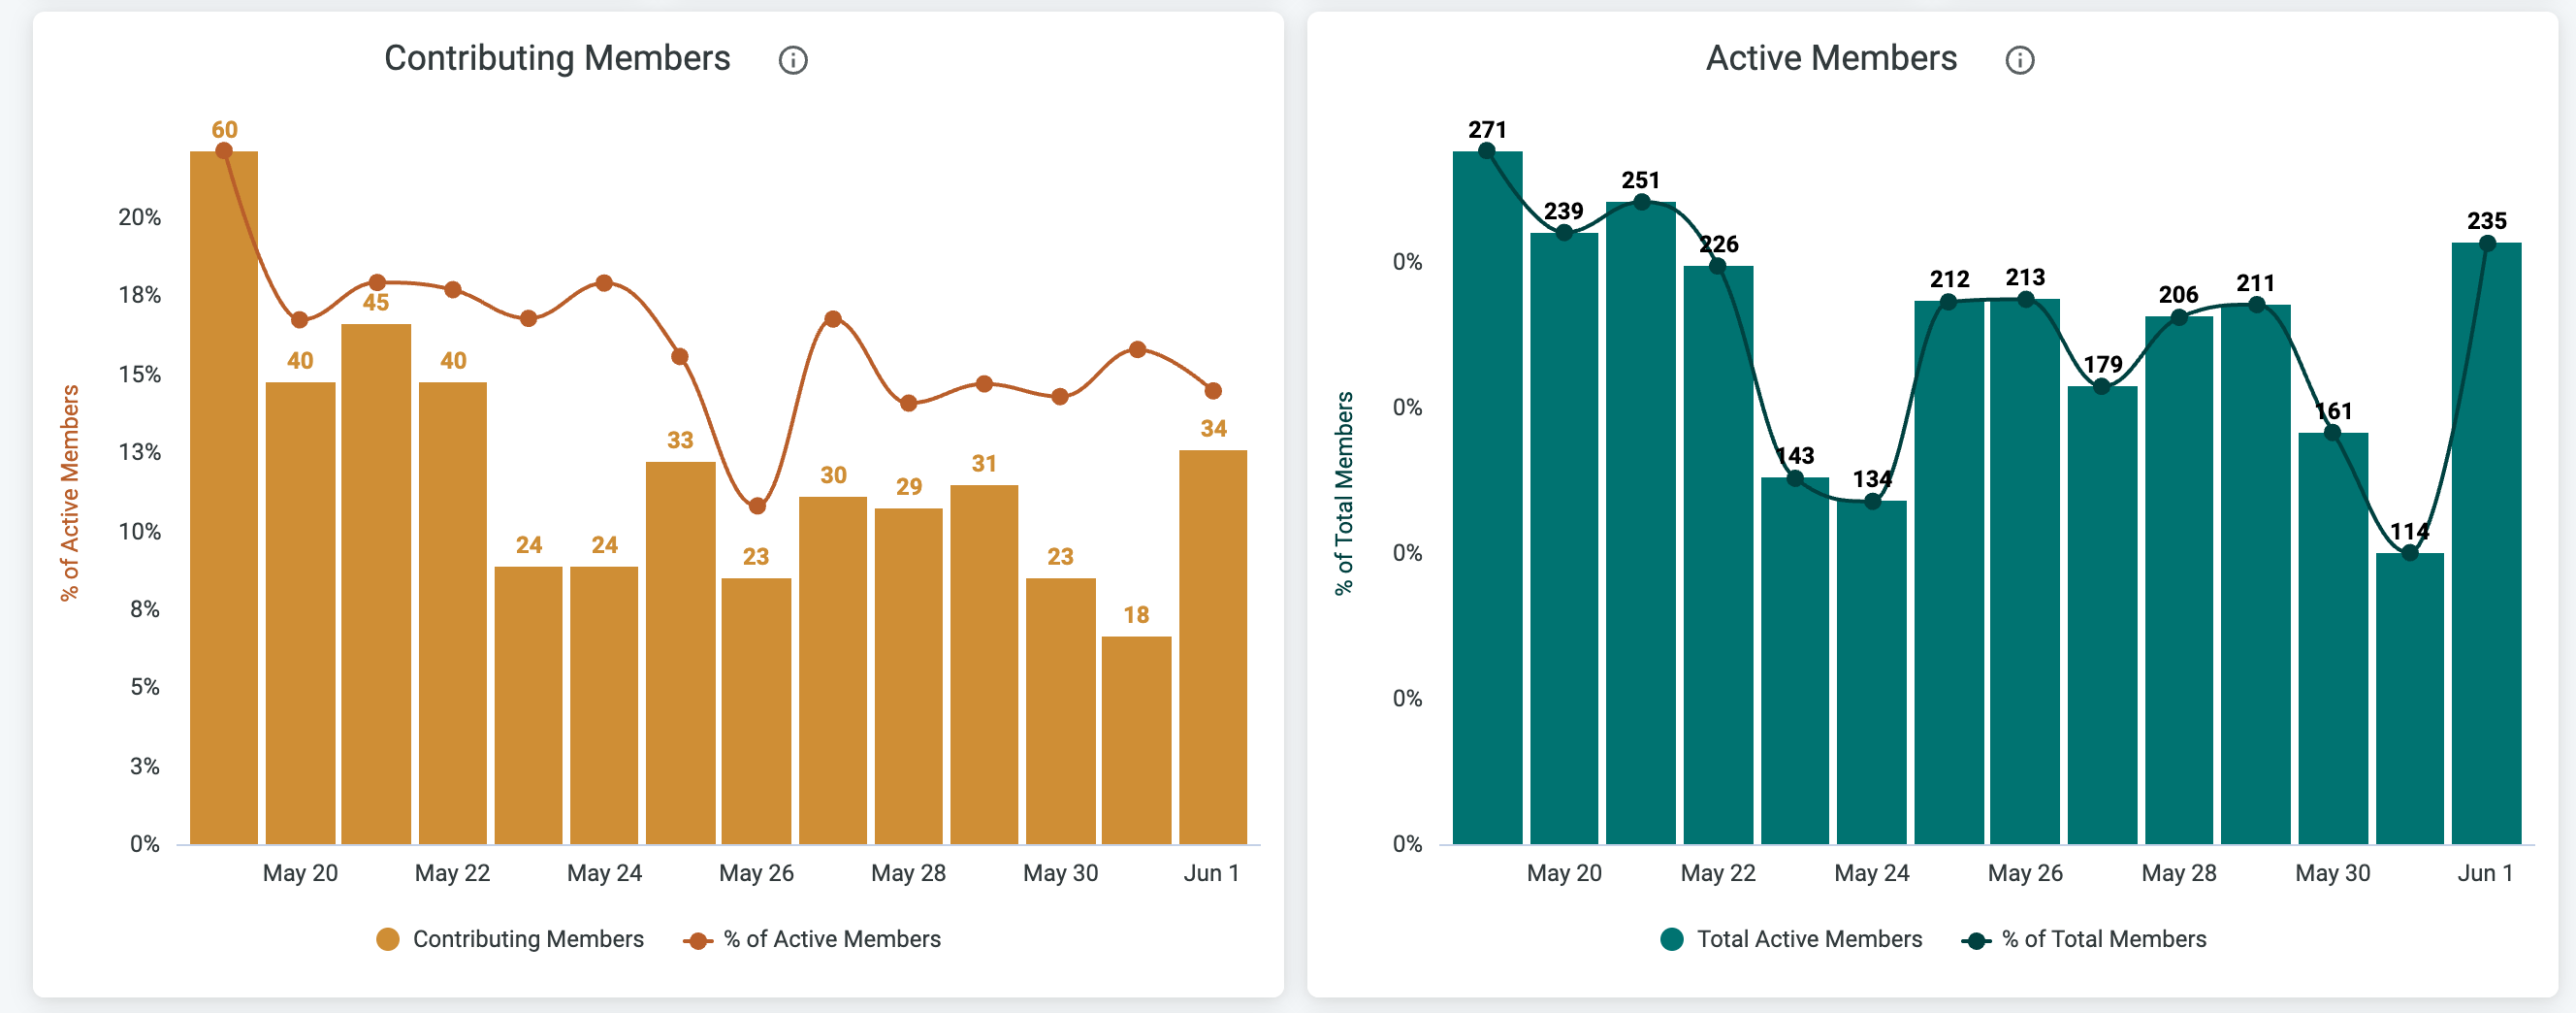
- Contributing Members
- The number of contributing members compared to the number of active members during the selected date range and space.
- Active Members
- The number of active members compared to the number of total members during the selected date range and space.
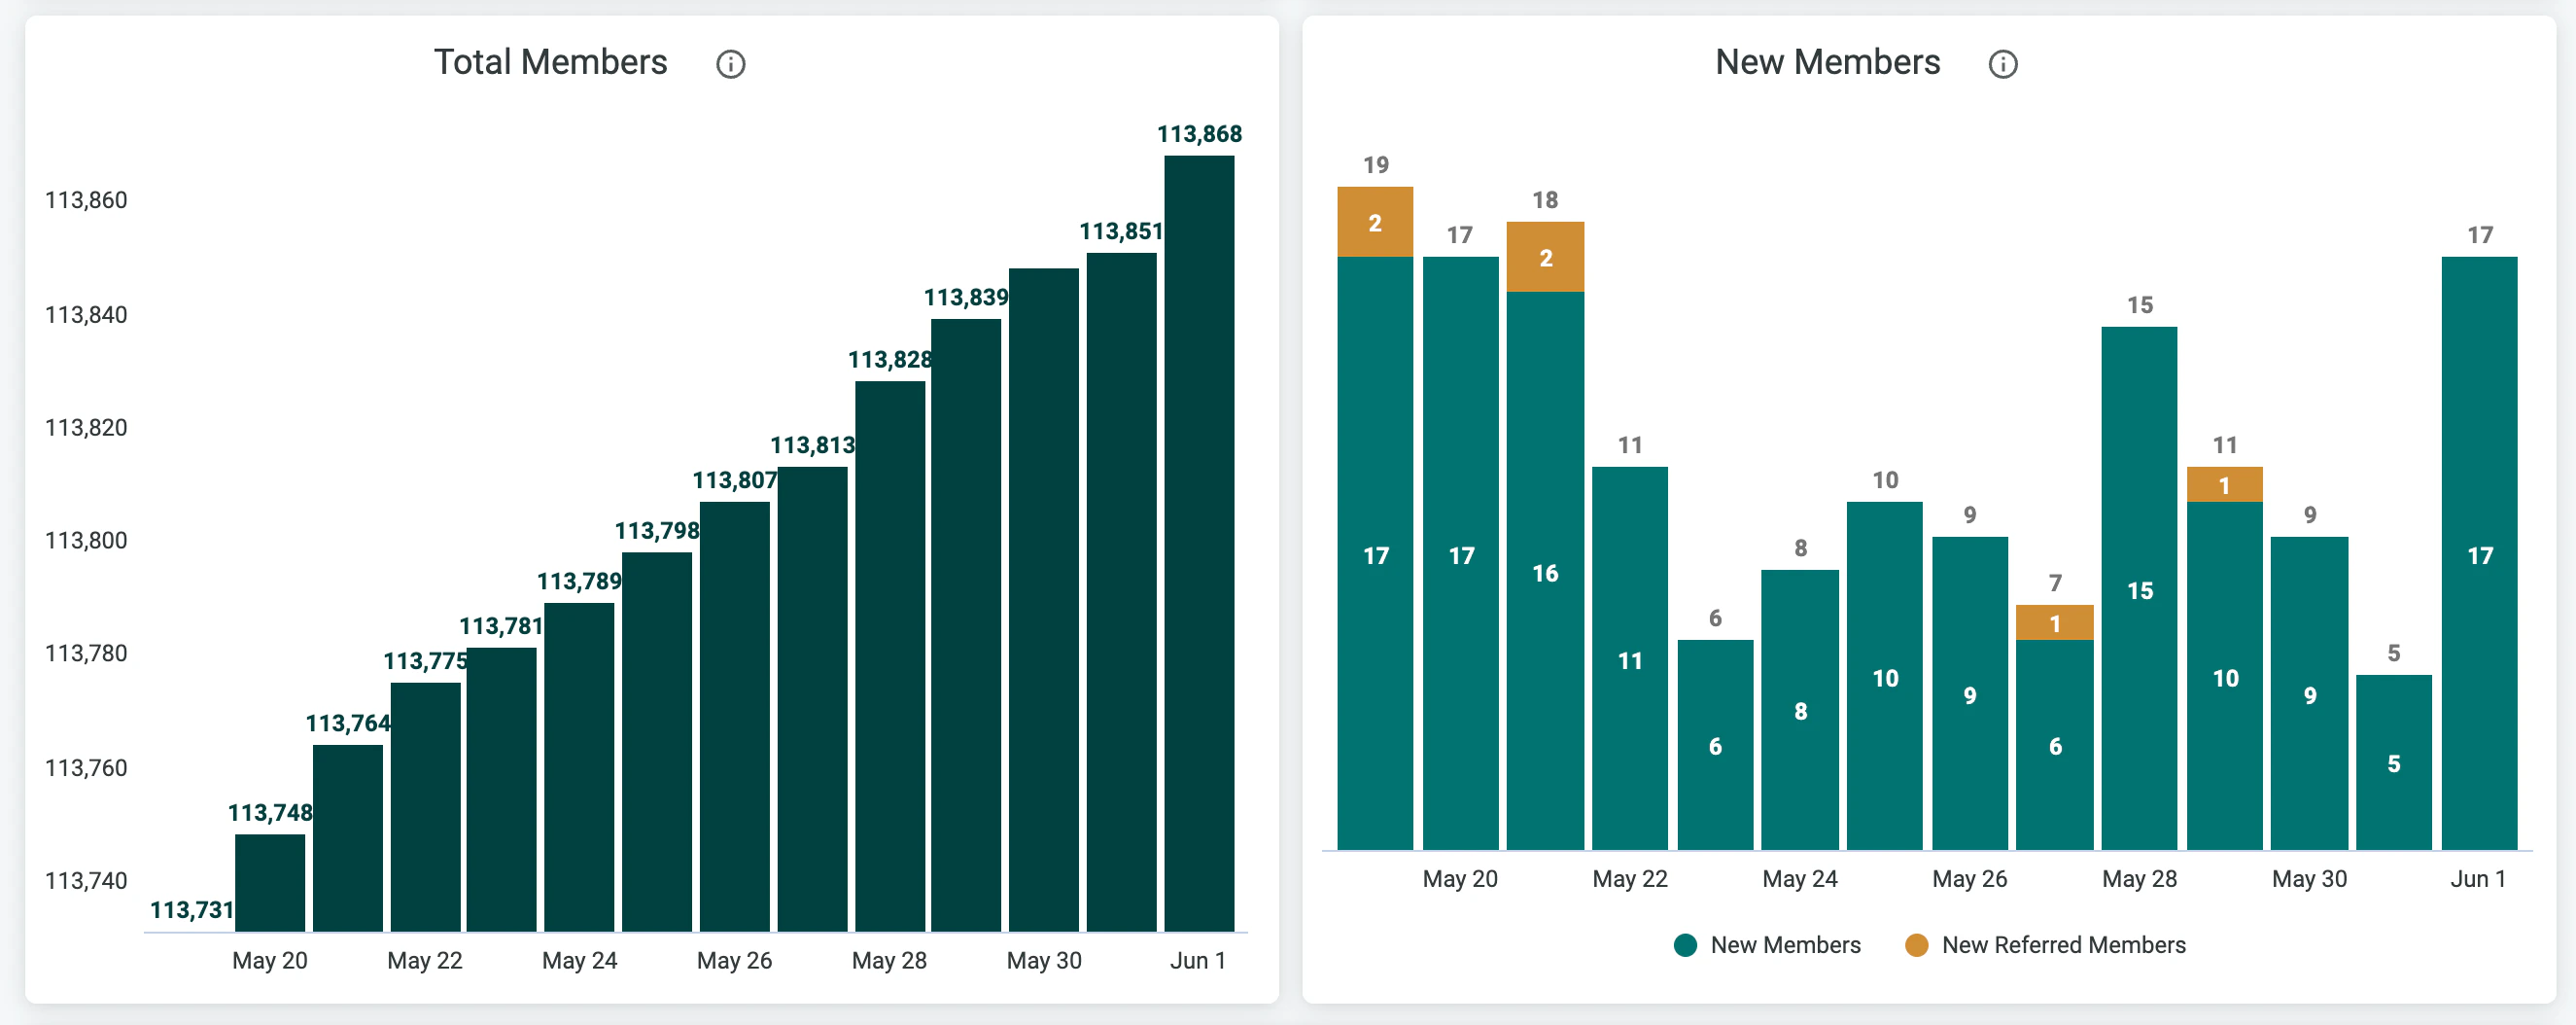
- Total Members
- Total members in your Mighty Network
- New Members
- The number of new members that have joined during the selected date range and space.
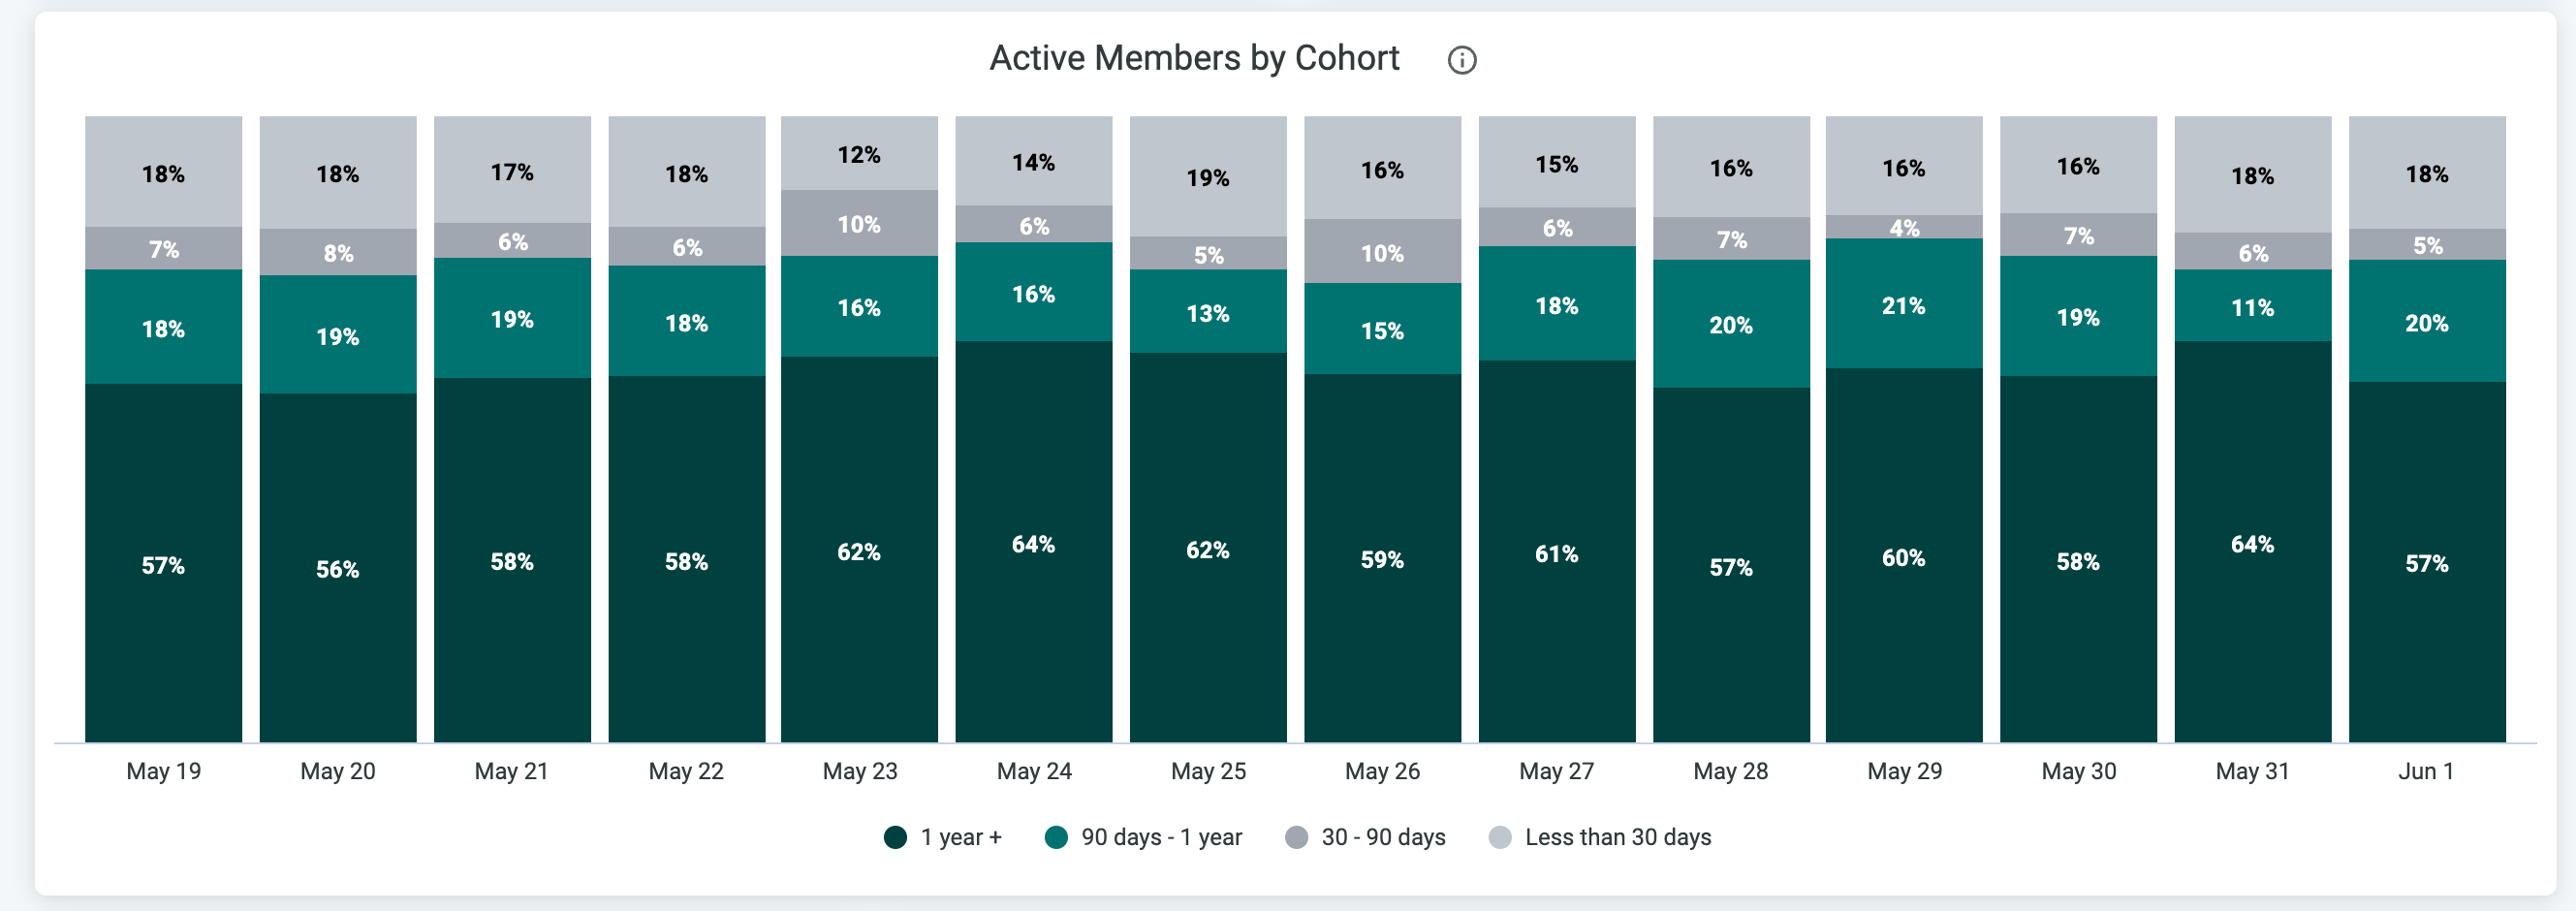
- Active Members by Cohort
- The number of active members by different mmber cohorts defined by the number of days since they joined.
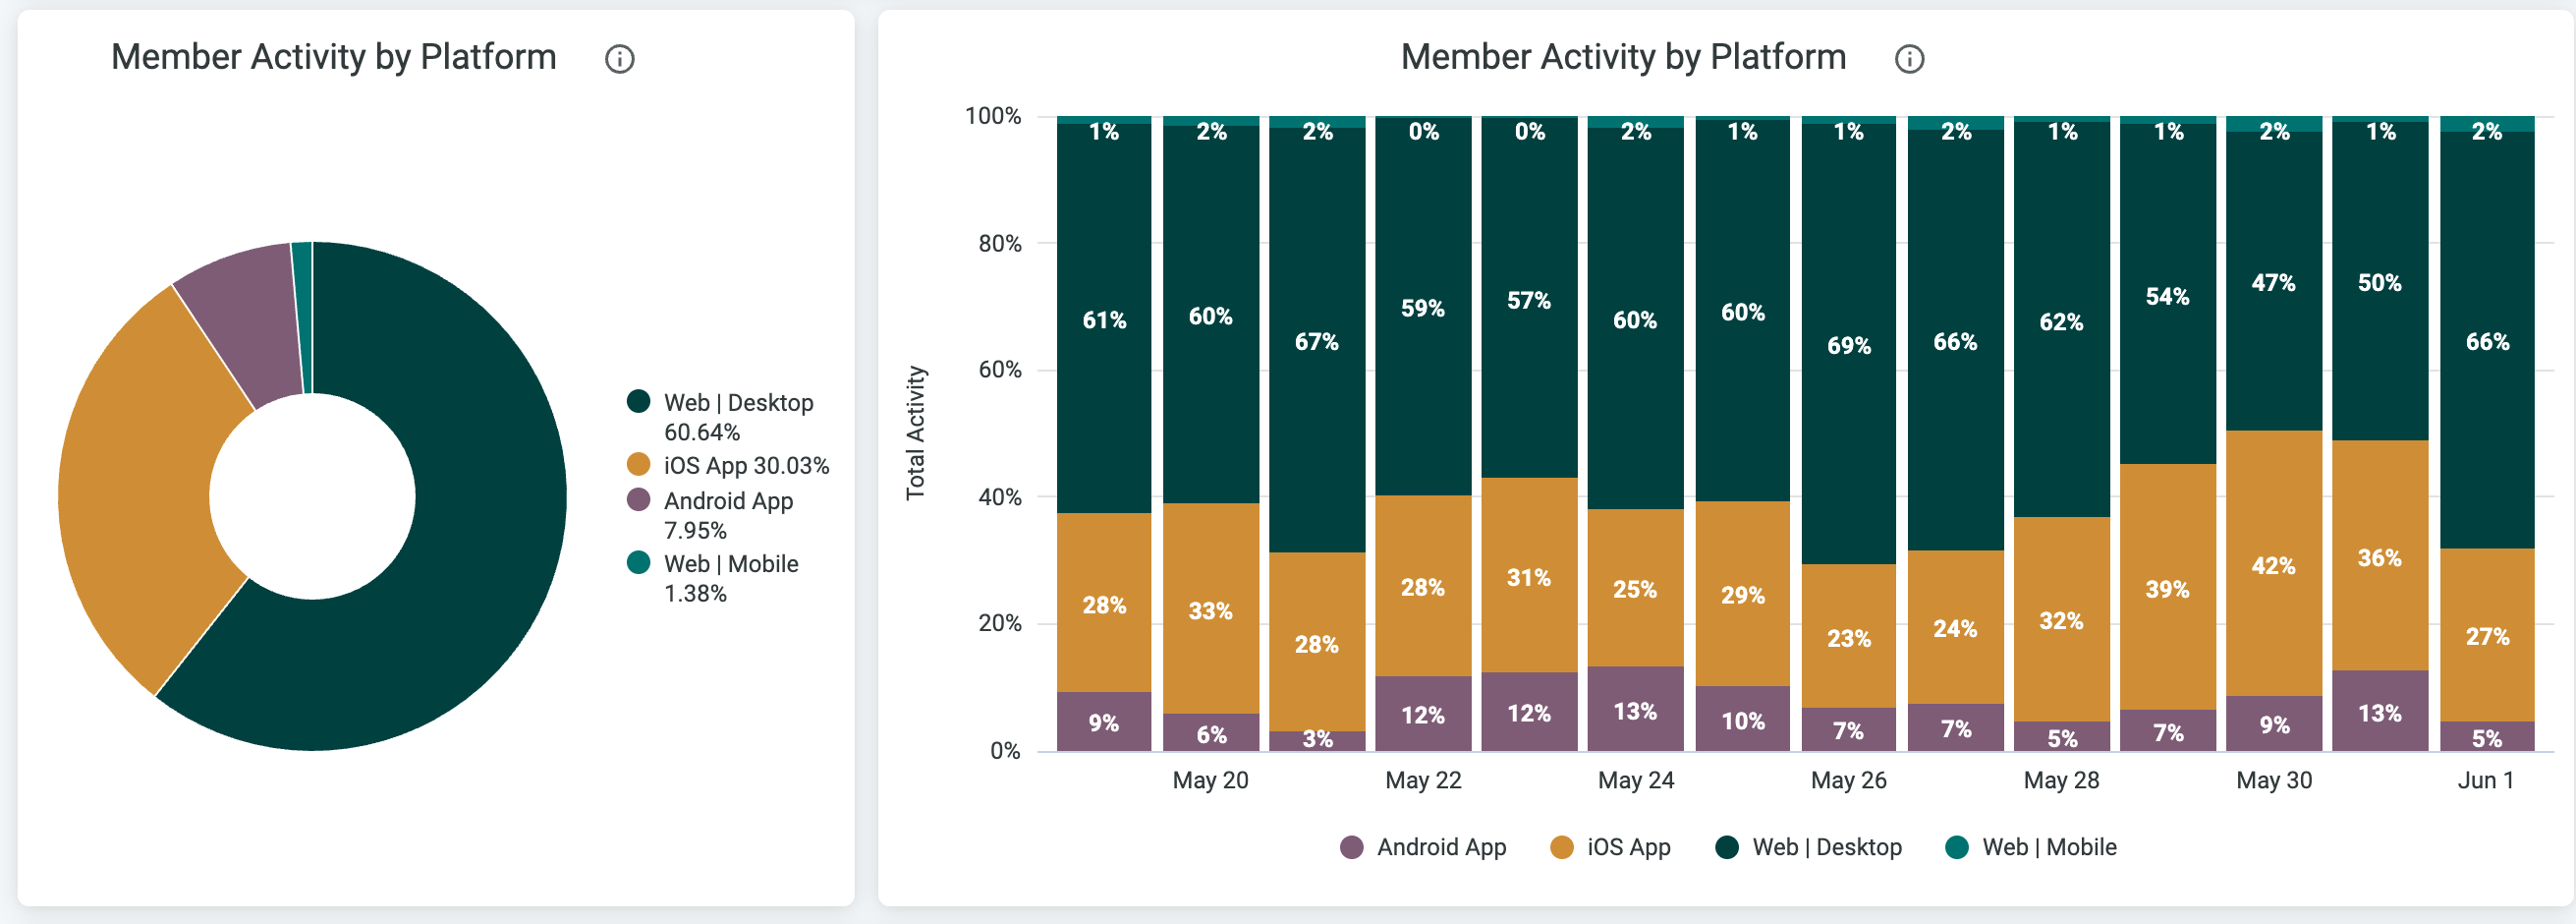
- Member Activity by Platform
- The percentage of activity in the Network that came from each platform.
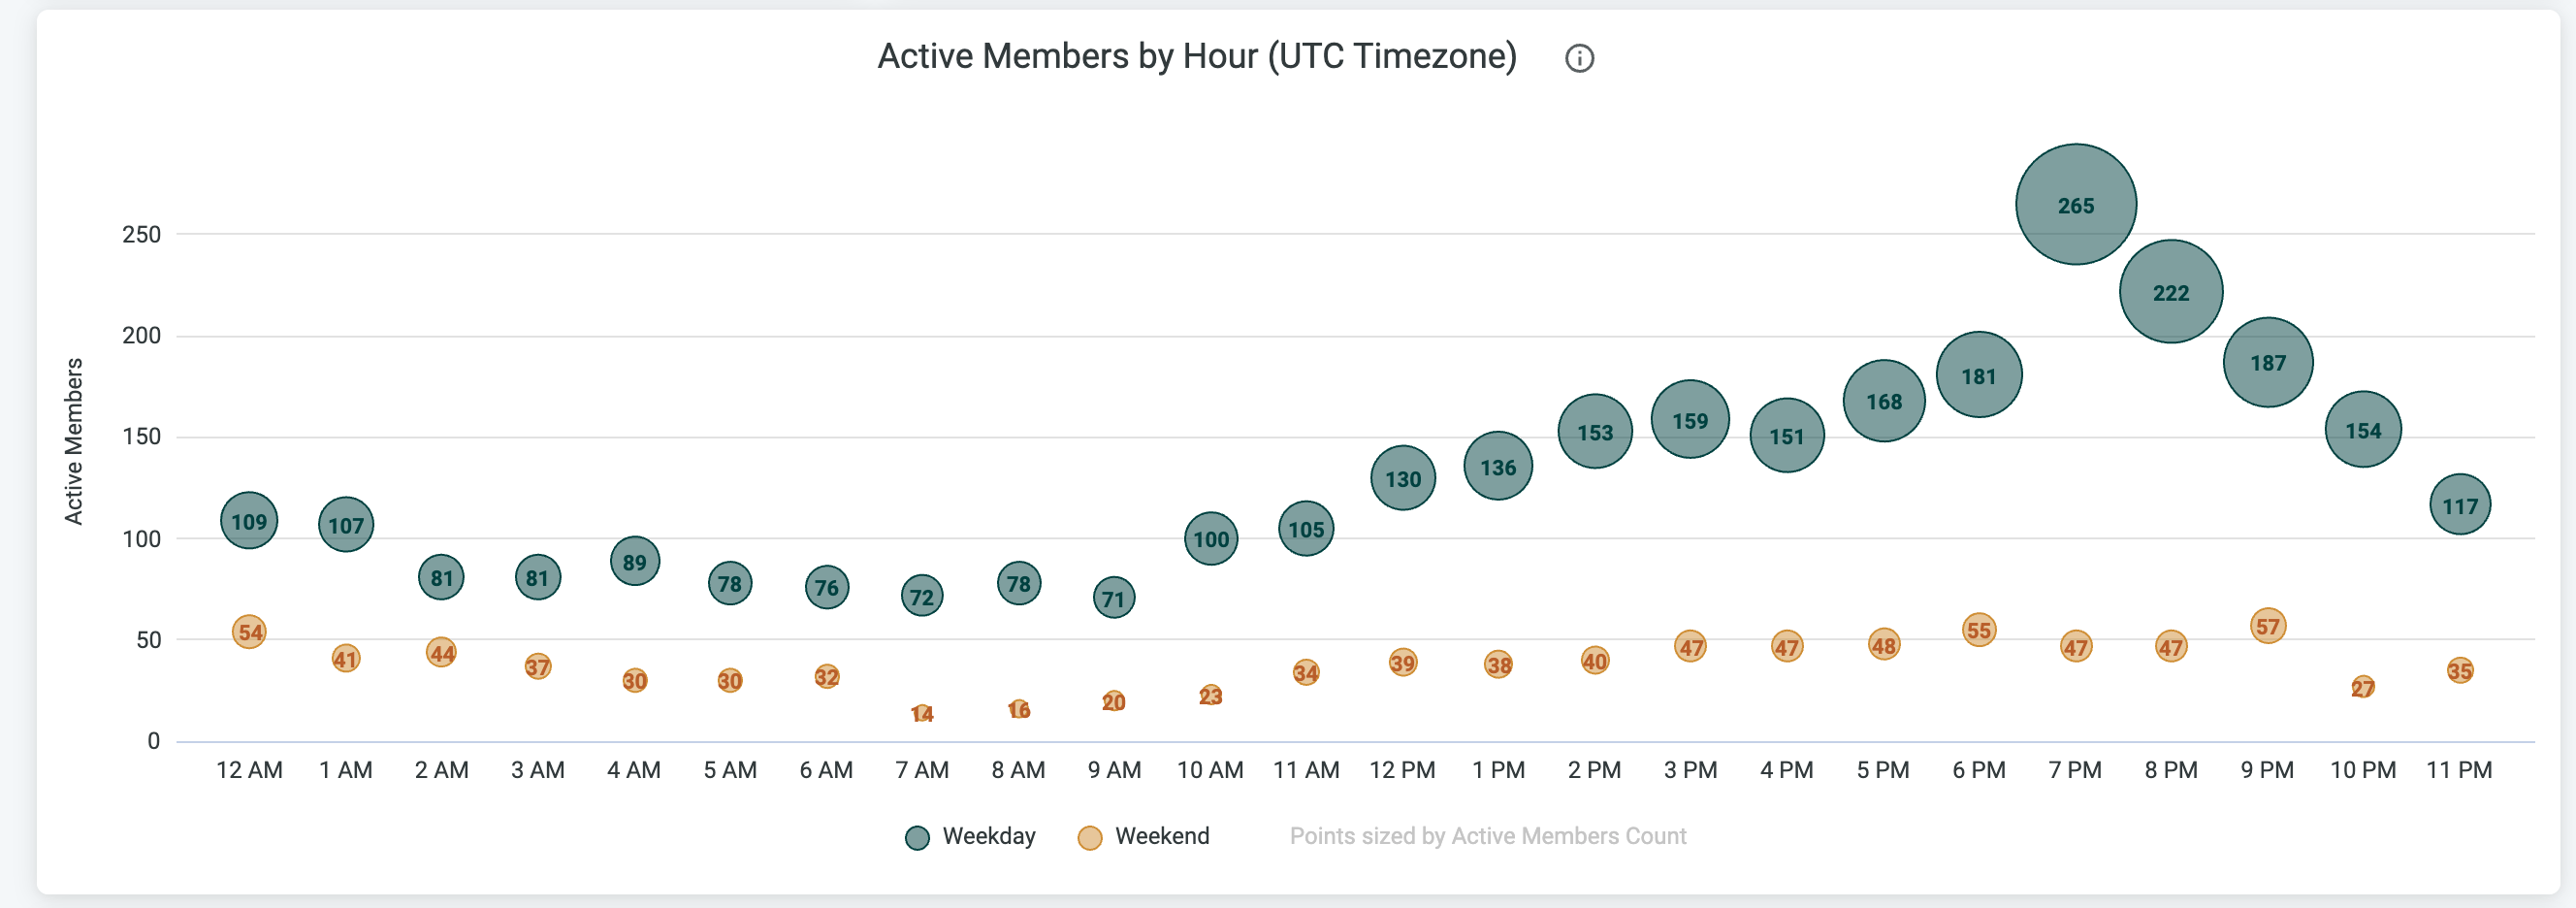
- Active Members by Hour
- The total number of active members in the Network during a specific hour of the day, in UTC time, for weekend days or weekdays.
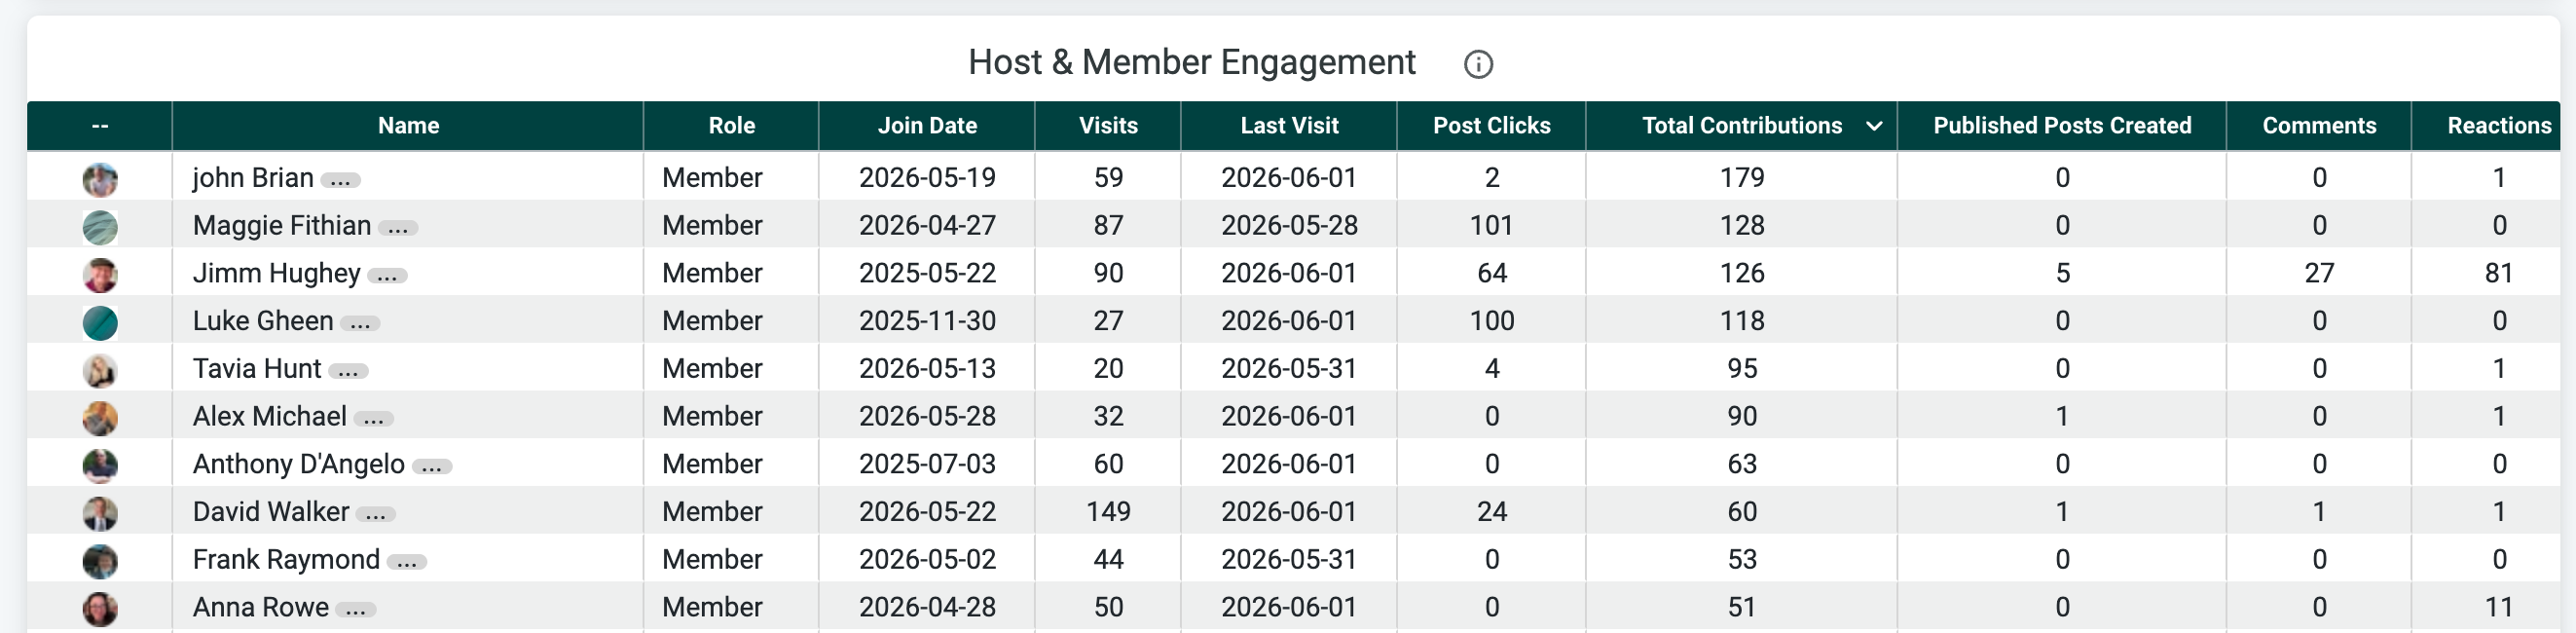
- Host and Member Engagement
- Members, moderators, and Hosts sorted by Total Contributions (Contributions include the metrics in this table and exclude visits).
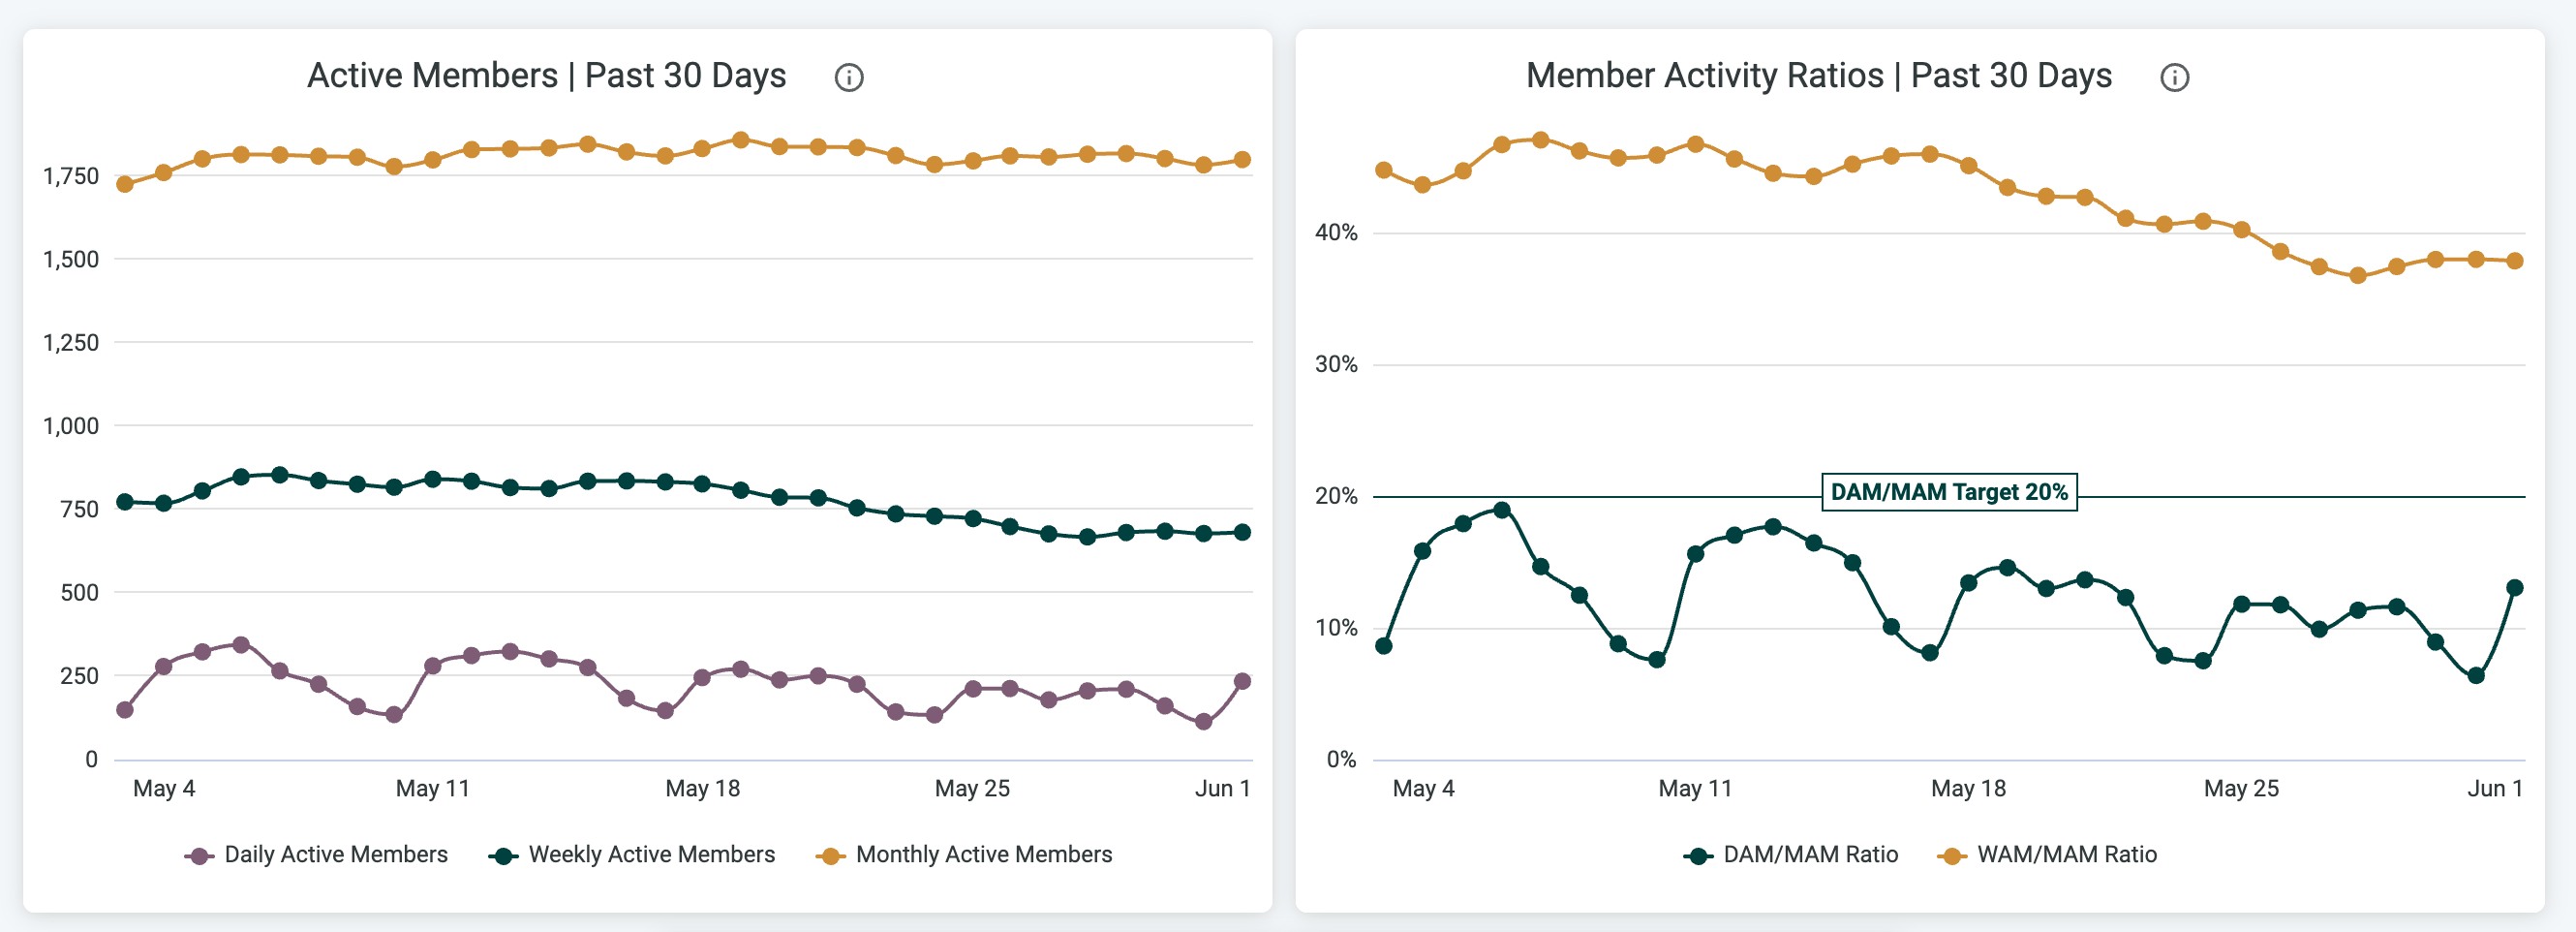
- Active Members (Daily, Weekly, and Monthly Active Members, past 28 days)
- DAM are members who visited your Network that day. WAM are members who visited your Network during the previous 7 days. MAM are members who visited your Network during the previous 30 days.
- Member Activity Ratios (DAM/MAM and WAM/MAM ratios, past 28 days)
- Member Activity Ratios are a measure of the frequency with which your members visit your Network. Note, this chart always shows the last 30 days and will not adjust with the date filter.

- Active Members Heatmap (past 24 months)
- The number of active members in the Network on each day with the darker colors representing a greater number of members.
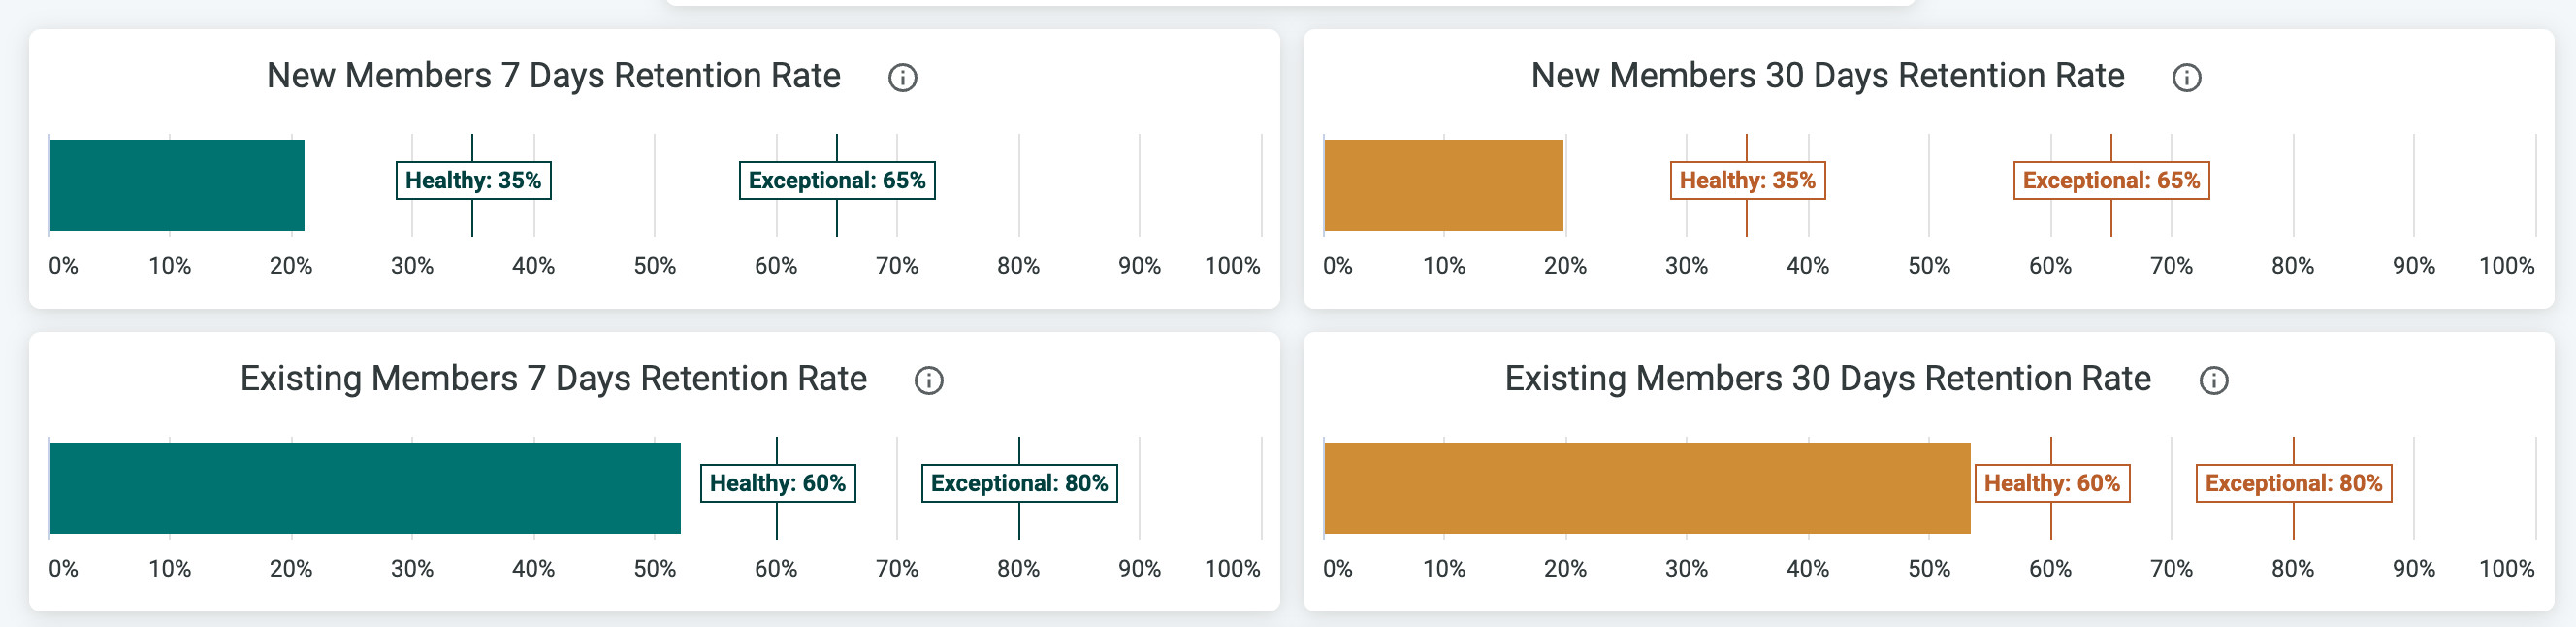
- New Members 7 Days Retention Rate
- The percentage of members who joined 14-20 days ago and returned 8-14 days after joining.
- New Members 30 Days Retention Rate
- The percentage of members who joined 60-89 days ago and returned 31-60 days after joining.
- Existing Members 7 Days Retention Rate
- The percentage of members who visited 8-14 days ago, who also visited in the past 7 days, excluding members who joined in the past 14 days.
- Existing Members 30 Days Retention Rate
- The percentage of members who visited 31-60 days ago, who also visited in the past 30 days, excluding members who joined in the past 60 days.
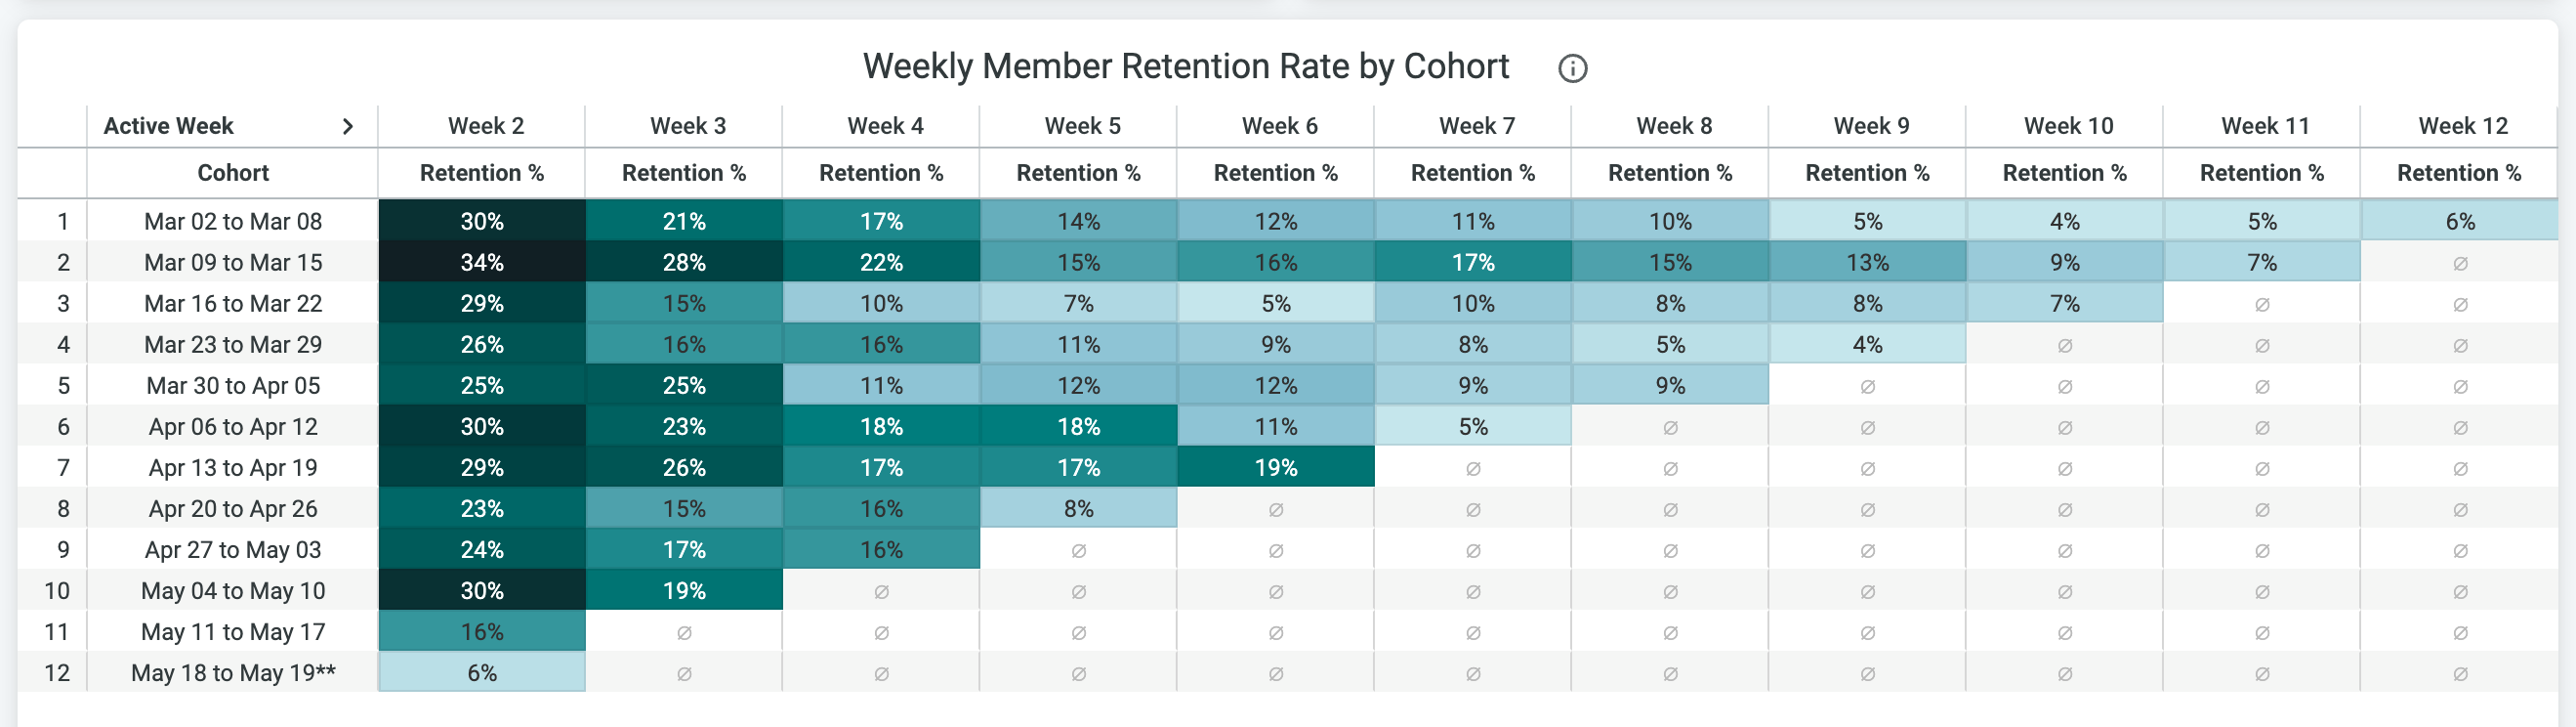
- Weekly Member Retention Rate by Cohort
- The percentage of members, who joined during any given week (called a Cohort), that return in the weeks following.
Understanding Your Data
Host & Member Engagement Table
Shows a ranking of your most active Hosts, moderators, and members by Engagement Score. Columns: Join Date • Visits • Last Visit • Post Clicks • Total Contributions • Published Posts Created • Comments • Reactions • Votes • RSVPs • Shares • Messages Sent • Courses Started • Courses Completed • Lessons Started • Lessons Completed • Current Streak • Max Streak • Recognitions Received • Recognitions Given Engagement Score calculation (weights):- Posts Created: 20 (Introductions count as 10)
- Post Clicks: 1
- Comments: 10 (includes comments on Courses)
- Reactions: 2
- Votes: 8
- RSVPs: 10
- Messages Sent: 4
- Followers: 0

Member Detail Page
You’ll see a member’s:- Join Date
- Last Contribution
- Last Visit
- Current Streak
- Max Streak
- Followers
- Following
- Custom Profile Fields
- Total Contributions
- Badges
- Top 20 Posts Member Engaged With
- Subscription History
- Purchase History

Subscription History table—“Subscription Renewal (Yes/No)” column:
- No: First payment of a new subscription (not a renewal).
- Yes: All payments after the initial one (renewals of an existing subscription).
Active Members by Cohort
Active Members by Cohort helps you understand who is contributing in your Mighty Network—both by posting and interacting with posts—based on how long they’ve been members. Cohorts group members by tenure (for example: 0–30 days, 31–90 days, 90+ days). Reviewing this view regularly can help you keep engagement balanced across new and long-time members.What to Look For
- Lower activity from members who joined in the last 90 daysThis can be a sign that new members need more support or encouragement to participate. Consider prompts, welcome threads, or low-stakes ways to “break the ice.”
- Lower activity from long-time membersThis may indicate it’s time to re-engage veteran members with new challenges, Events, or conversations to help them stay connected over time.
Activity by Platform
The Activity by Platform charts show what percentage of your Mighty Network’s activity comes from each platform: Web/Desktop, iOS, Android, and Web/Mobile.- The first chart displays the overall percentage of activity by platform.
- The second chart shows how activity changes over the selected date range, helping you spot usage trends across platforms.
Active Members
You’ll also see active members across Hourly, Daily, Weekly, and Monthly timeframes. Frequent visits are a strong indicator that members find your Mighty Network valuable. As a rule of thumb:- Daily Active Members are your most engaged and committed members.
- Monthly Active Members tend to be more casual.
- 20% of members show up daily, and
- 50% show up weekly.
Active Members Heatmap
The Active Members Heatmap shows when your members were most active over the past two years. Darker shaded days indicate higher activity, giving you a useful guide for when to schedule posts or Events for the most impact.Member Retention Rate
Your member retention rate metrics show the percentage of new and existing members who return to your Mighty Network over time. You can view retention across 7-day, 30-day, and Weekly Member Retention by Cohort timeframes. In the weekly cohort view, the most recent cohort usually does not represent a full Monday–Sunday week. This is intentional—each member in that cohort must have been in your Mighty Network for at least 14 days to ensure the retention data is meaningful. These retention benchmarks are based on our internal research. We’ve found that thriving, long-lasting communities typically meet or exceed these metrics. Even if members aren’t actively contributing, they may still be spending meaningful time in your Mighty Network and getting value. These insights can help you make better decisions about when and how to encourage participation—especially during onboarding or through periodic reminders that reinforce your community culture. Your member growth charts can be filtered by individual Spaces or by your overall Mighty Network. These charts show how your membership is growing and what percentage of new members are joining through an invite or referral. A low referral percentage may indicate an opportunity to grow your Mighty Network by activating members through a referral campaign or the Ambassador Program.Custom Fields
Custom Fields will show you detailed data from the Custom Fields in your Network.
Custom Field Type
- Dropdown Single Select
- Dropdown Multi Select
- Long Text
- Short Text
Visibility
- Hidden
- Visible
Privacy
- Public
- Private
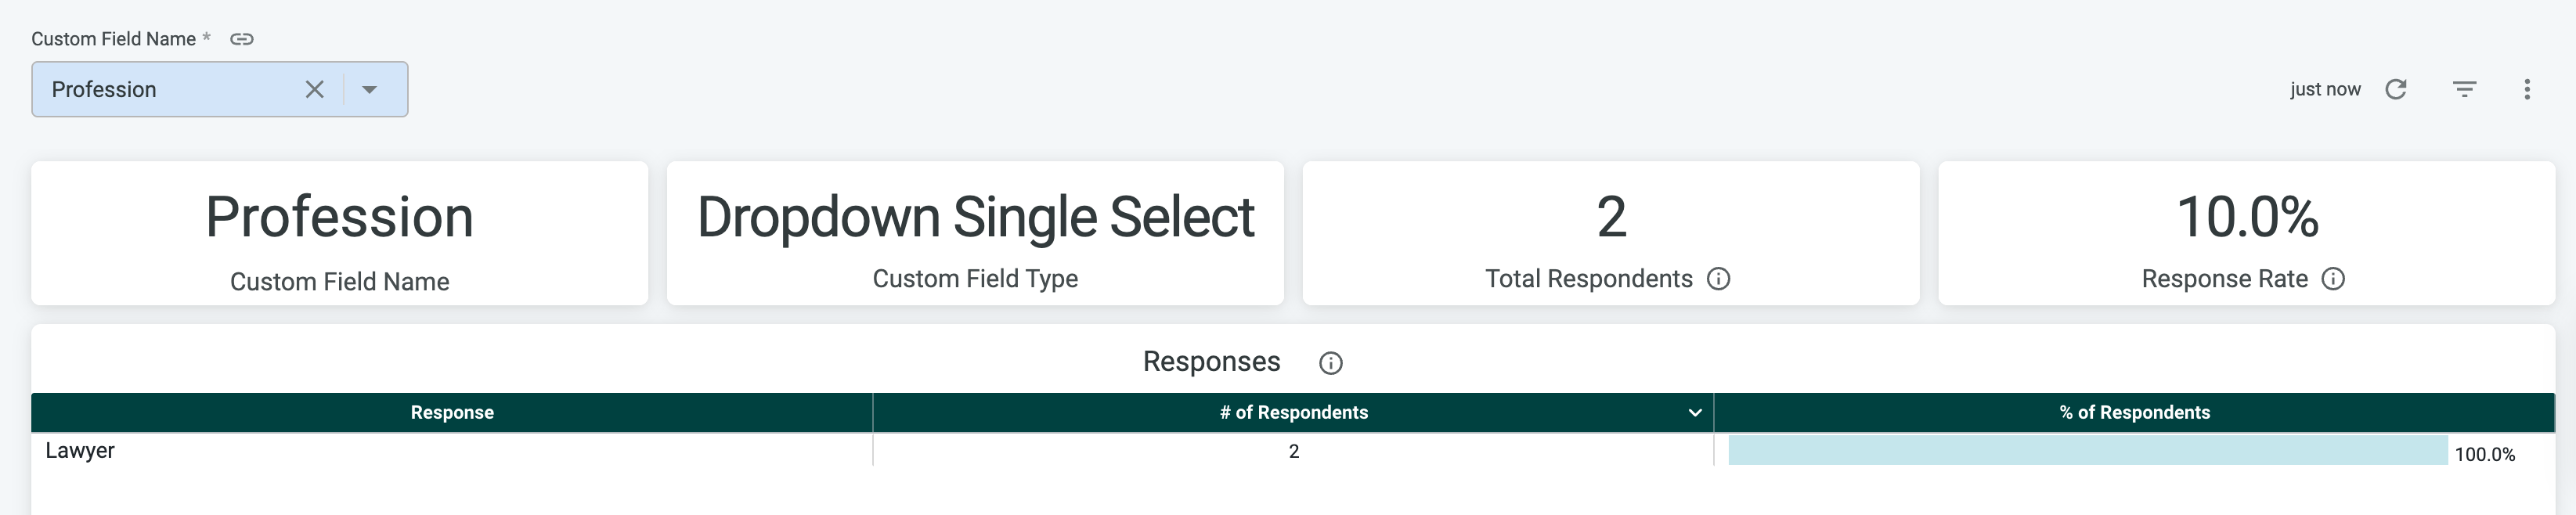
- Custom Field Name
- Custom Field Type
- Total Respondents
- Response Rate
- Response
- # of Respondents
- % of Respondents

- Response
- Member Name
- Role
- Join Date
- Last Active
Livestreams
The Livestreams dashboard gives you an overview of all livestream activity in your Mighty Network. You can filter the data by Space and select a date range from 7 days up to 1 year.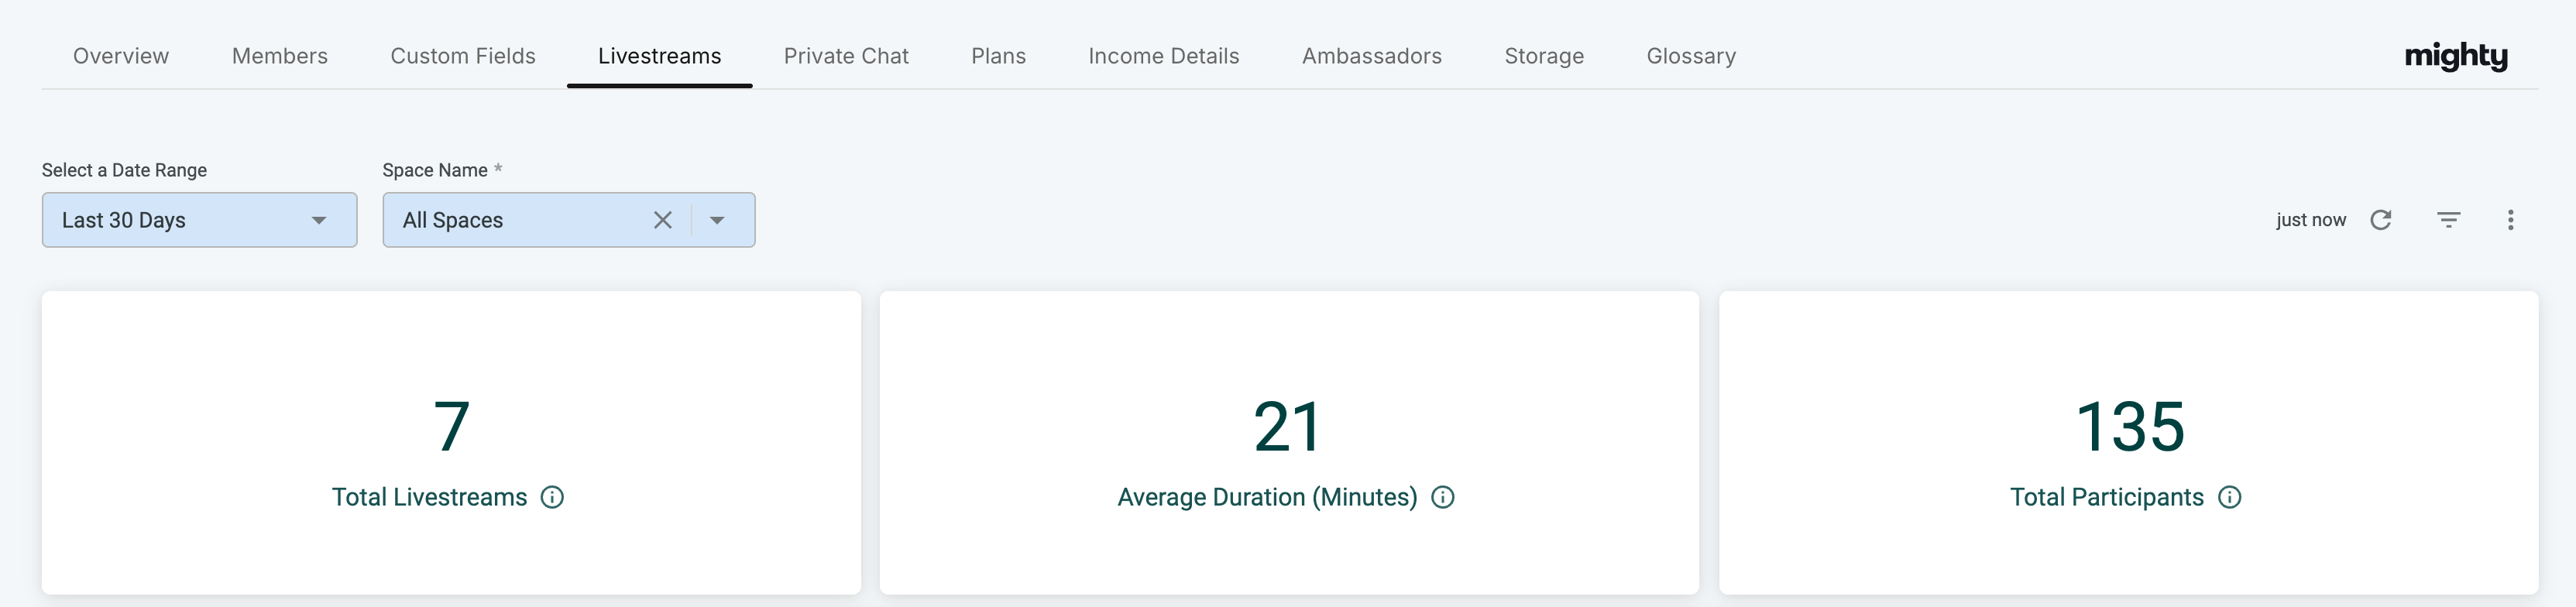
- Total Livestreams
- The total number of livestreams hosted during the selected date range.
- Average Duration
- The average length of livestreams in that period.
- Total Participants
- The total number of participants across all livestreams.This includes both viewers and speakers.
- Livestreams
- The number of livestreams during the selected time period. The number of livestreams is shown on a daily or monthly basis.
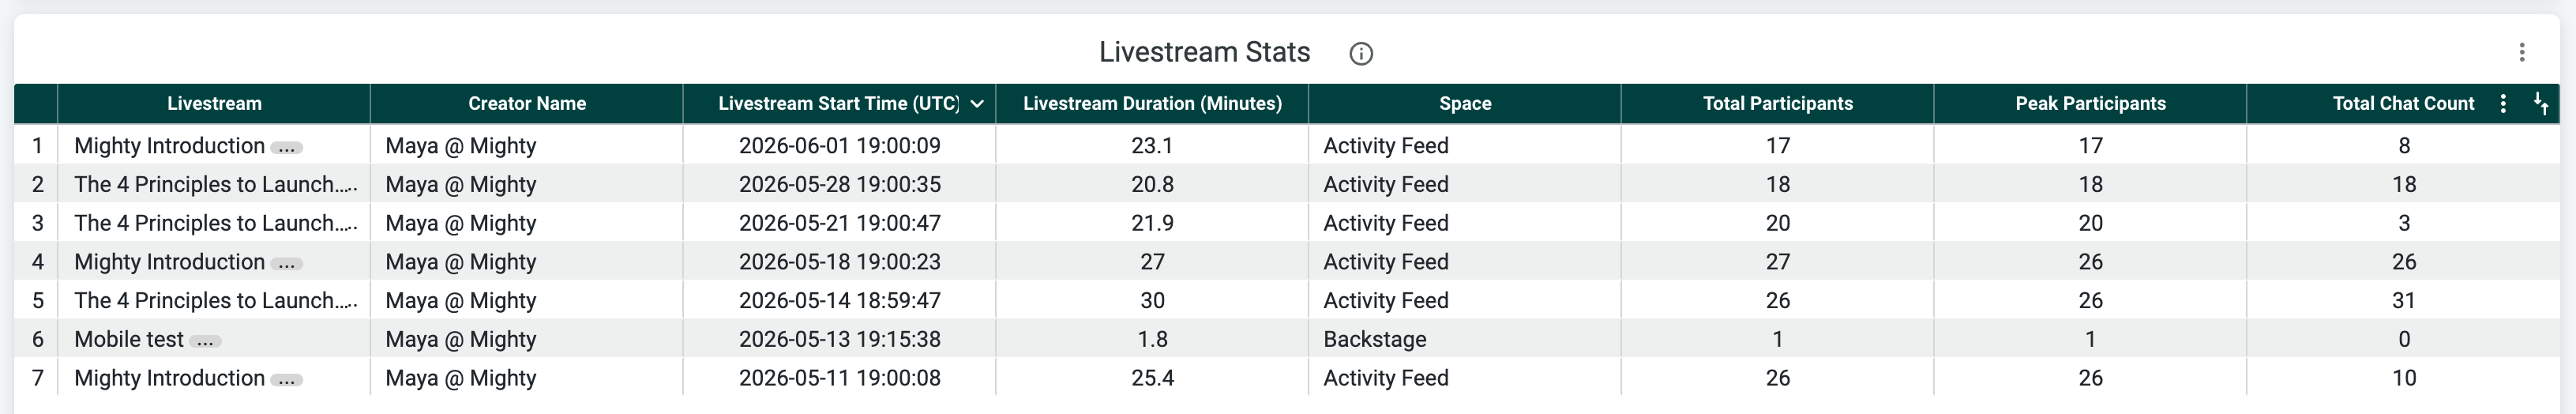
- Livestream Stats
- Details for each livestream including livestream name, start time, livestream duration, and participants. Click on the livestream name for more details on each livestream.
- Livestream name
- Creator Name
- Livestream Start Time (UTC)
- Livestream Duration (Minutes)
- Total participants
- Peak participants
- Total Chat count (number of messages sent during the livestream)
- Details for each livestream including livestream name, start time, livestream duration, and participants. Click on the livestream name for more details on each livestream.


- Participants
- The total number of people in the livestream including viewers and speaker(s).
- Livestream duration (minutes)
- The length of the livestream in minutes.
- Livestream Start Date (UTC)
- The time and date the livestream started. Date displayed is calculated from UTC.
- Livestream Start Time (UTC)
- The time and date the livestream started. Time displayed is in UTC.
- Average View Time (minutes)
- The average view time for the livestream.
- Participants During Livestream
- The number of viewers and speaker(s) in the livestream by minute.
- First Name
- Last Name
- Role
- View Time (minutes)
Private Chat
The Private Chat dashboard shows analytics for private and group messaging between your members. High levels of private messaging can be a strong indicator that members are connecting with each other and getting value from your Mighty Network.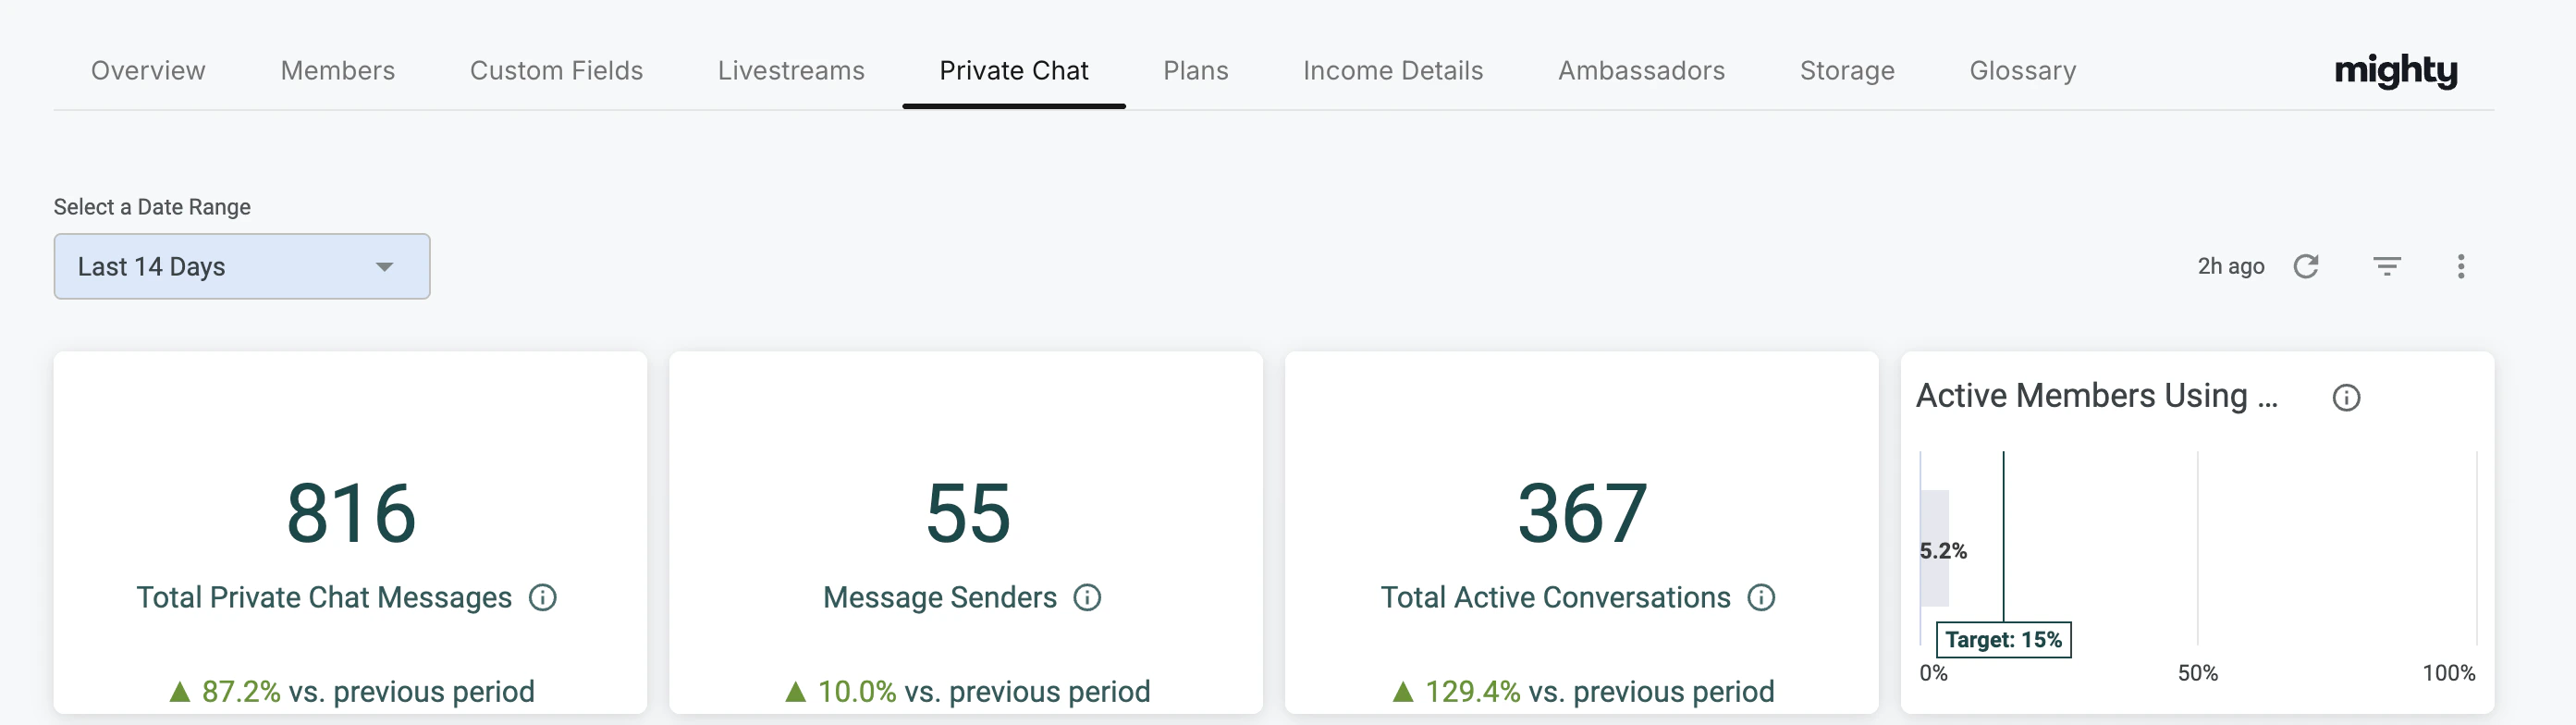
- iOS App
- Android App
- Web | Mobile
- Web | Desktop
Plans
The Plans dashboard shows your subscription and purchase activity over time. You can view subscriptions by the currency they were sold in, convert revenue metrics into 10 different currencies, and click into charts—such as Subscriptions or Free Trials Started—to see the list of members included on a specific date.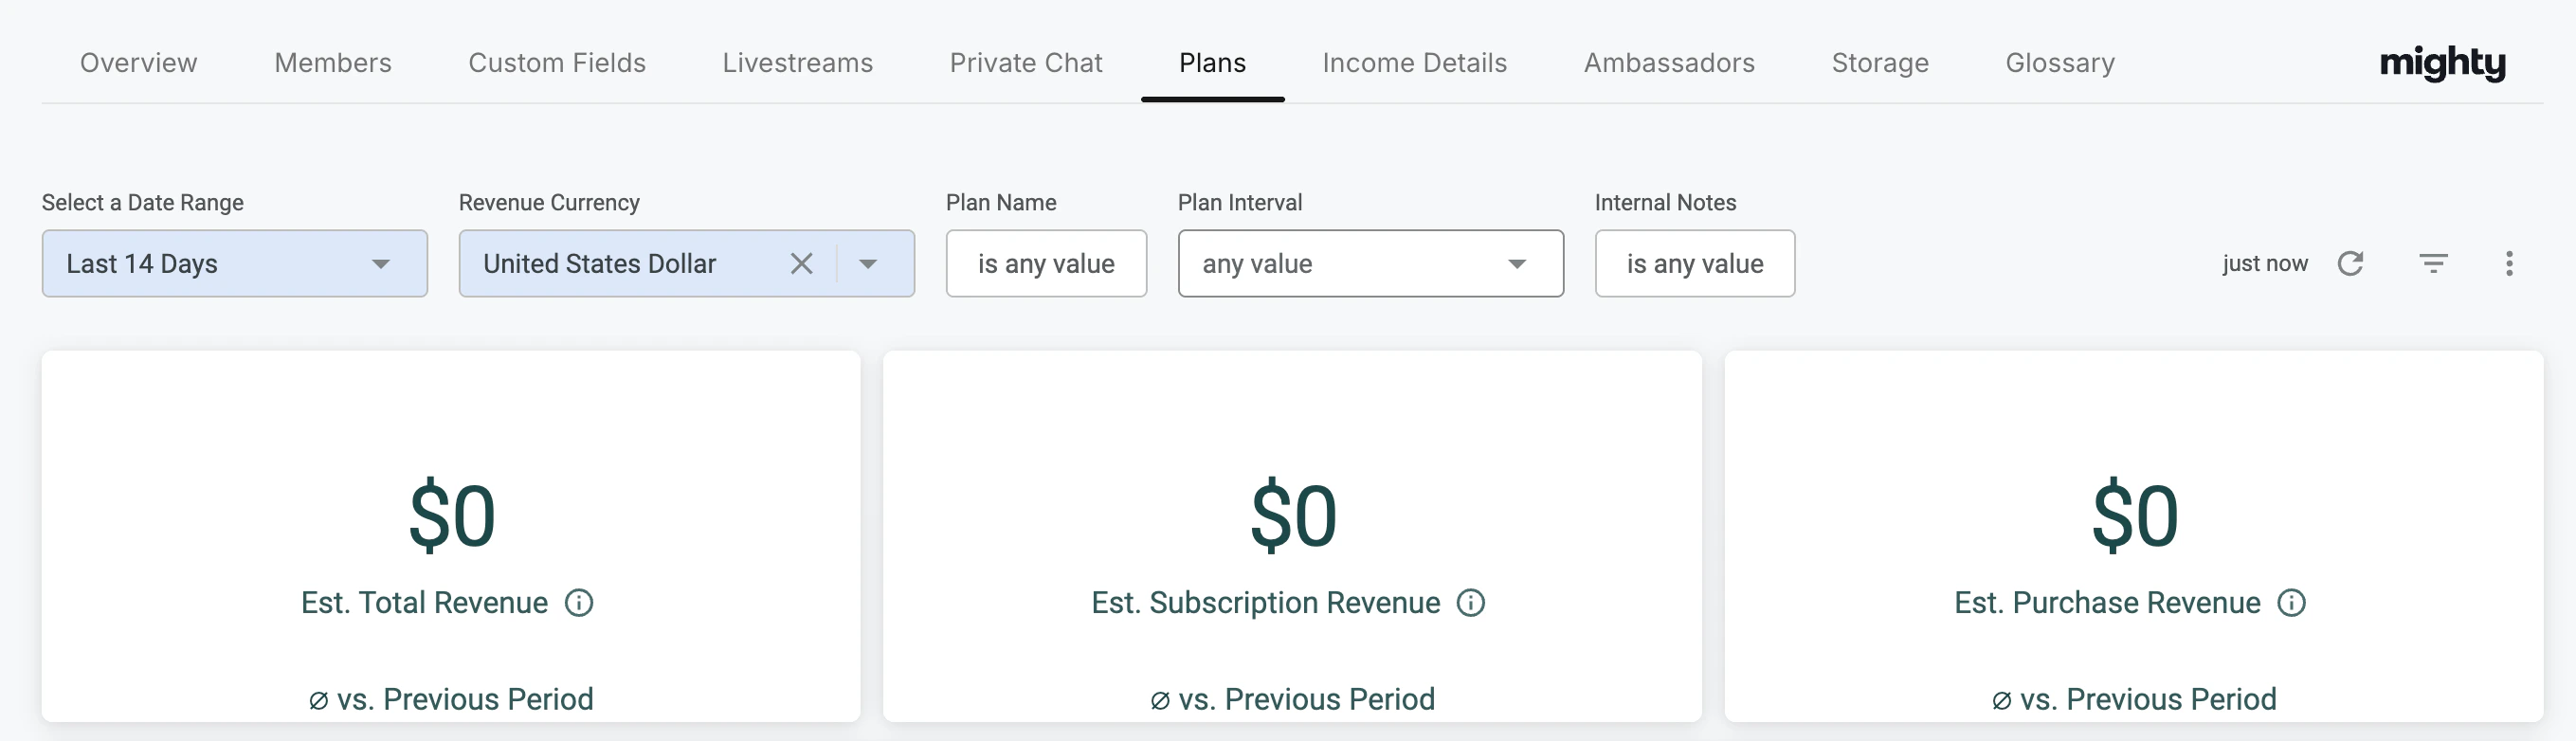
- Est. Total Revenue: Estimated revenue from subscriptions and one-time purchases.
- Est. Subscription Revenue: Estimated revenue from subscriptions started or renewed during the date range.
- Est. Purchase Revenue: Estimated revenue from one-time purchases.
Subscriptions Started and Renewed by Plan
A breakdown of subscription activity by plan, including:- Plan Name
- Payment Platform
- Subscription Interval
- Plan Price
- Monthly Price
- of Starts
- of Renewals
- Estimated Revenue
One-Time and Installment Purchases by Plan
- Plan Name
- Pricing Type
- Plan Price
- # of Installments
- Installment Amount
- # of Transactions
- Estimated Revenue
- Name (of the purchaser)
- Created At date
- Plan Name
- Pricing Type
- Currency
- Plan Price
- Promotion Price
- Promo Code
Subscriptions
- Active Subscriptions: The number of active paid subscriptions (excludes free subscriptions and free trials).
- Active Subscribers: The number of members with active paid subscriptions (excludes free trials).
- Churn Rate: The percentage of subscriptions that have churned out of all subscriptions that either churned or renewed.
- Subscriptions Started: The number of new paid subscriptions started during the selected date range.
- Subscriptions Renewed: The number of subscriptions renewed during the selected date range.
- Subscriptions Churned: The number of subscriptions that ended during the date range.
- Subscriptions Canceled (Stripe only) The number of cancellations recorded via Stripe.
- Subscription Movement Due to Plan Switch: Tracks subscriptions that changed because a member switched plans.
- Active Free Trials: The number of members currently on a free trial.
- Free Trials Started: The number of free trials initiated during the date range.
- Free Trials Ended: The number of free trials that ended during the date range.
- Active Subscriptions: Shows the number of active paid subscriptions. Free subscriptions and free trials are not included.
- Subscription Retention Rate: Shows the number of subscriptions renewed and ended.The retention rate is calculated as: Renewed Subscriptions ÷ All Subscriptions Up for Renewal
- Subscriptions Started and Renewed: Shows the number of subscription starts, renewals, and subscriptions that started due to members moving between plans.
- Subscription Started and Renewed by Plan: A table showing the number of starts and renewals for each plan during the selected date range.
- Subscriptions Canceled: Shows the number of subscriptions canceled. Canceled subscriptions remain active until the end of the billing period.
- Subscriptions Churned: Shows the number of subscriptions that ended, including those that ended due to members switching plans.
Subscription Free Trials
Under Subscriptions Free Trials you will be able to see- Active Free Trials: Shows the total number of active free trials across all plans during the selected date range.
- Free Trials Started: Shows the number of free trials that began during the selected date range.
- Free Trials Ended: This chart includes two key metrics:
- Number of Free Trials Ended: All free trials that concluded during the selected date range, including those that converted into paying subscriptions and those that did not.
- Conversion Rate:
- The percentage of ended trials that converted into paid subscriptions. Calculated as: Converted Trials ÷ Total Trials Ended
- Important Note on Trial End Dates
- Trial end dates are determined by the scheduled end of the trial—not early cancellations.
- For example, a 7-day free trial will appear as “ended” on day 7, even if the member cancels before that day.
One-Time and Installment Purchases by Plan
Under One-Time and Installment Purchases, you can review activity and revenue for all one-time and installment-based plans.- Pricing Type
- Plan Price
- # of Installments
- Installment Amount
- # of Transactions
- % of Transactions (the percentage of all one-time purchases attributed to that plan)
Downloading Member Data
Clicking any bar chart in the Plans dashboard opens a detailed view showing the individual members and data behind that chart. To download this data—including member email addresses—open the three-dot menu, select Download Data, choose CSV or Excel, and select As displayed in the data table.Income Details
The Income Details tab shows daily updated income information from your Plans. You can sort and filter this data to review your revenue activity in more detail.Invoice Date
There are preset options to choose from, ranging from Today all the way back to the Previous Year. You can also filter the data using a custom date range. Plan Name You can select any “Bundle Name” to see all of the members that have purchased that Plan. Payment Platform You will be able to sort either by Stripe payment or iOS (if enabled as an option). Payment Type This will display the subscription type categories for the plans available in your Network.- Name: Purchaser name
- Plan Name: Name of the plan
- Interval: Payment interval (Monthly, Annual, or One-time)
- Invoice Date: Date the transaction took place
- Currency: Currency used for the charge
- Amount: Amount charged
- Promo Code: Promotion code applied, if any
- Payment Platform: Stripe or iOS
- Payment Type:
- New Subscription
- Subscription Renewal
- One-time Purchase
- Also shows as New Subscription if a member moved plans
- Internal Notes: Notes added during plan creation
- Download Options: All data can be downloaded
- For total revenue summaries, go to the Plans tab or filter the Income Details report by date range, download it, and sum the totals.
- Sales tax, refunds, failed payments, and cancellations are not included in this data.
Ambassadors
If you have the Ambassador Program enabled, you’ll have access to the Ambassadors dashboard. At the top, you’ll see the total number of Gold, Silver, and Bronze Ambassadors. The table below displays a full list of your Ambassadors, including:- Ambassador name
- Number of referrals
- Ambassador Level
- Dates when they reached Bronze, Silver, or Gold levels
Storage
The total storage used in your Mighty Network is broken down by images, files, videos, and other uploaded formats—including livestream recordings. Avatars are not included in total storage. Course material videos are excluded from storage only on legacy plans with unlimited course videos; on newer plans (Explore, Launch, Scale, Growth), course videos count toward your storage limit. You’ll see your overall storage usage along with a percentage breakdown of the categories that make it up:- Images – Any image file uploaded in posts or comments (excluding avatars)
- Files – Uploaded documents such as PDFs, spreadsheets, and similar formats
- Videos – Native videos uploaded to your Mighty Network
- External embeds (YouTube, Vimeo, etc.) are not included
- Course material videos are excluded only on legacy plans with unlimited course videos; on newer plans (Explore, Launch, Scale, Growth), course videos count toward storage
- Audio – Any uploaded audio file
- Livestream Recordings – Automatically saved recordings from livestreams
- Other – Any uploaded or attached file type not included in the categories above
Glossary
This is a great place to review all the terms we use in the Network Dashboard in Mighty Insights!Spaces Features
The Space Features Dashboards include: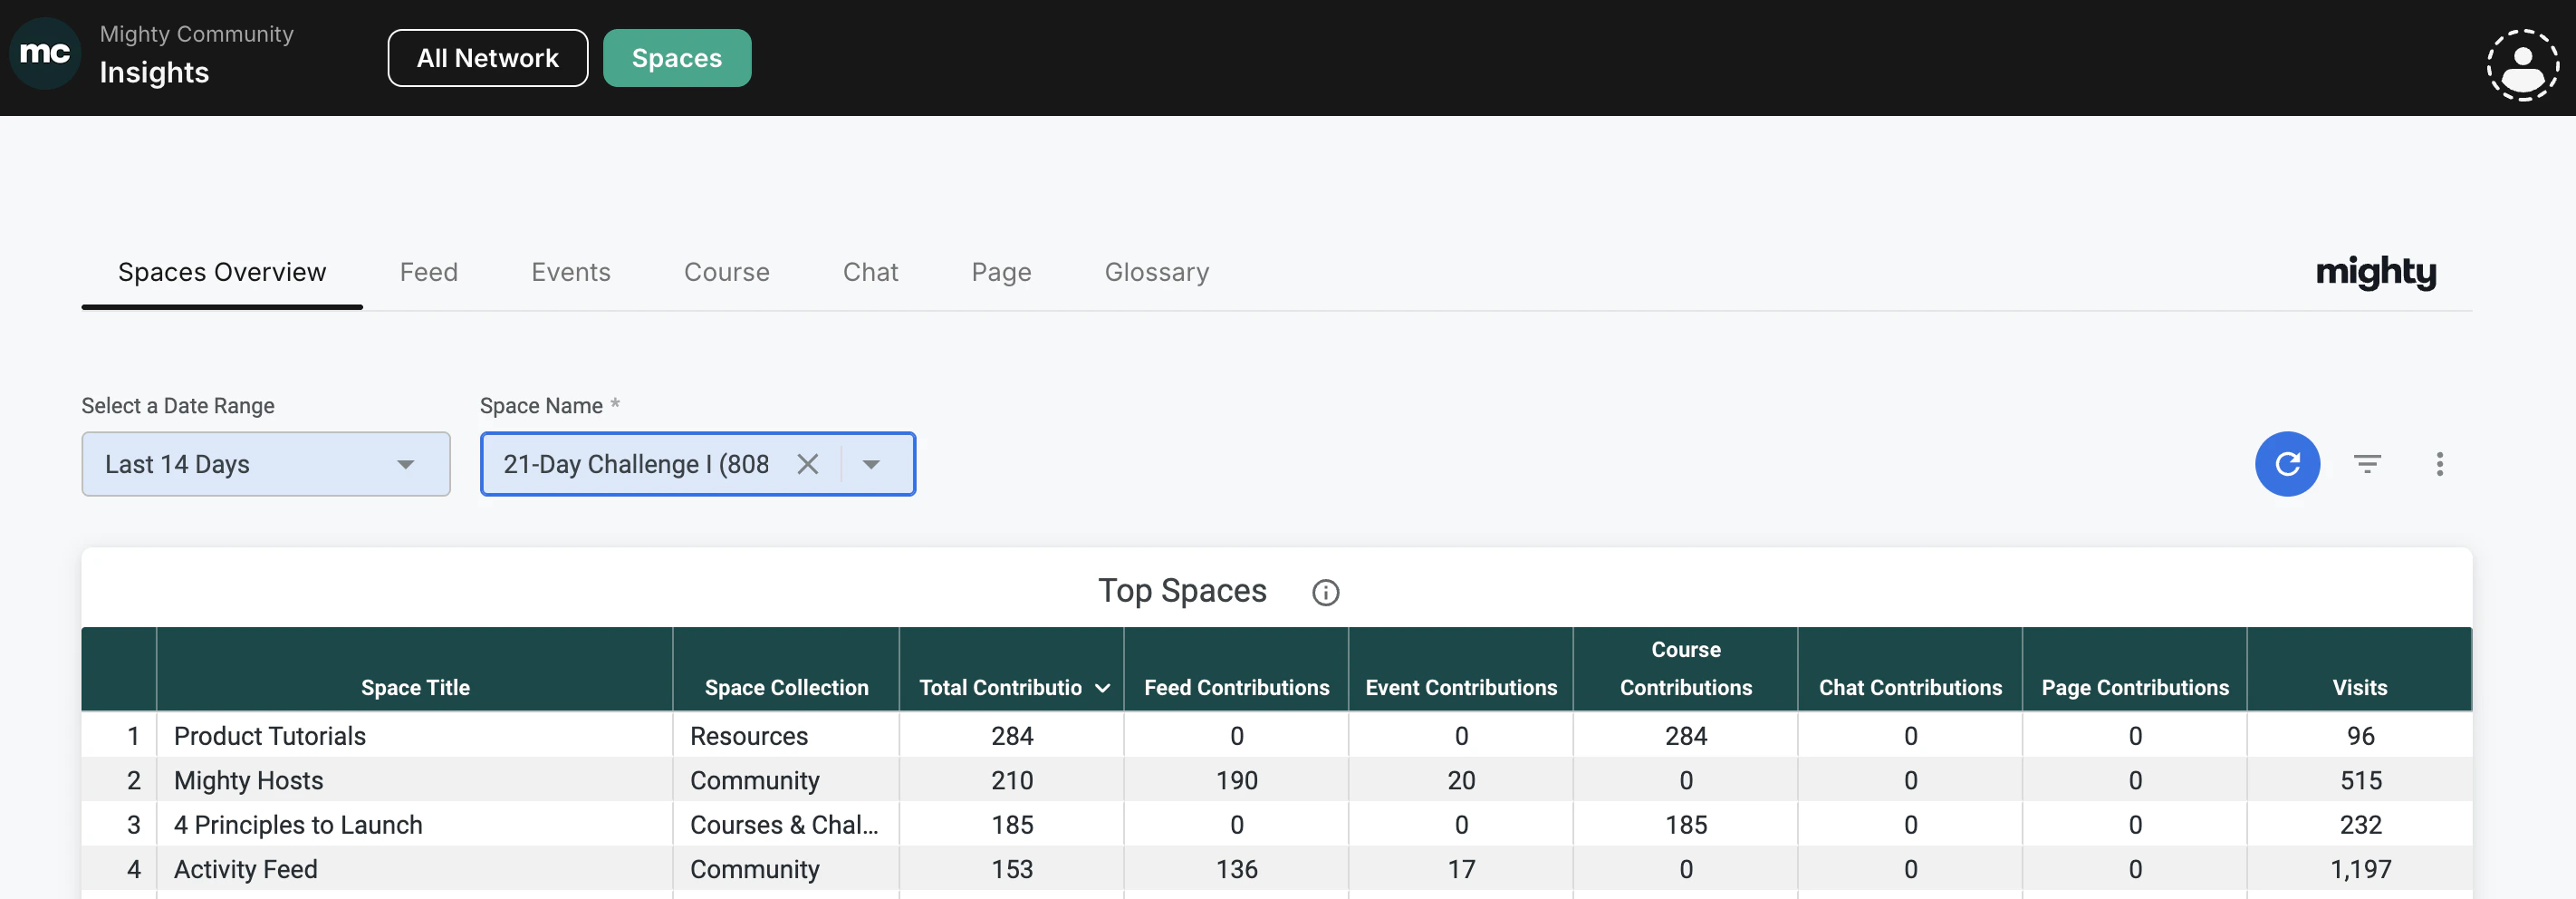
Spaces Overview
This dashboard gives you an overview of: Space Contributions, which shows you the contributions per feature to show you which is the most popular amongst your members. In the Top Spaces table, you can see which Spaces have the highest engagement. For each Space, you’ll find:- Space Title
- Space Collection
- Total Contributions
- Feed Contributions
- Course Contributions
- Chat Contributions
- Page Contributions
- Visits
Feed
This dashboard includes data for the Feed Space Feature, covering posts (Posts, Articles, Polls, Questions) and interactions (comments and reactions).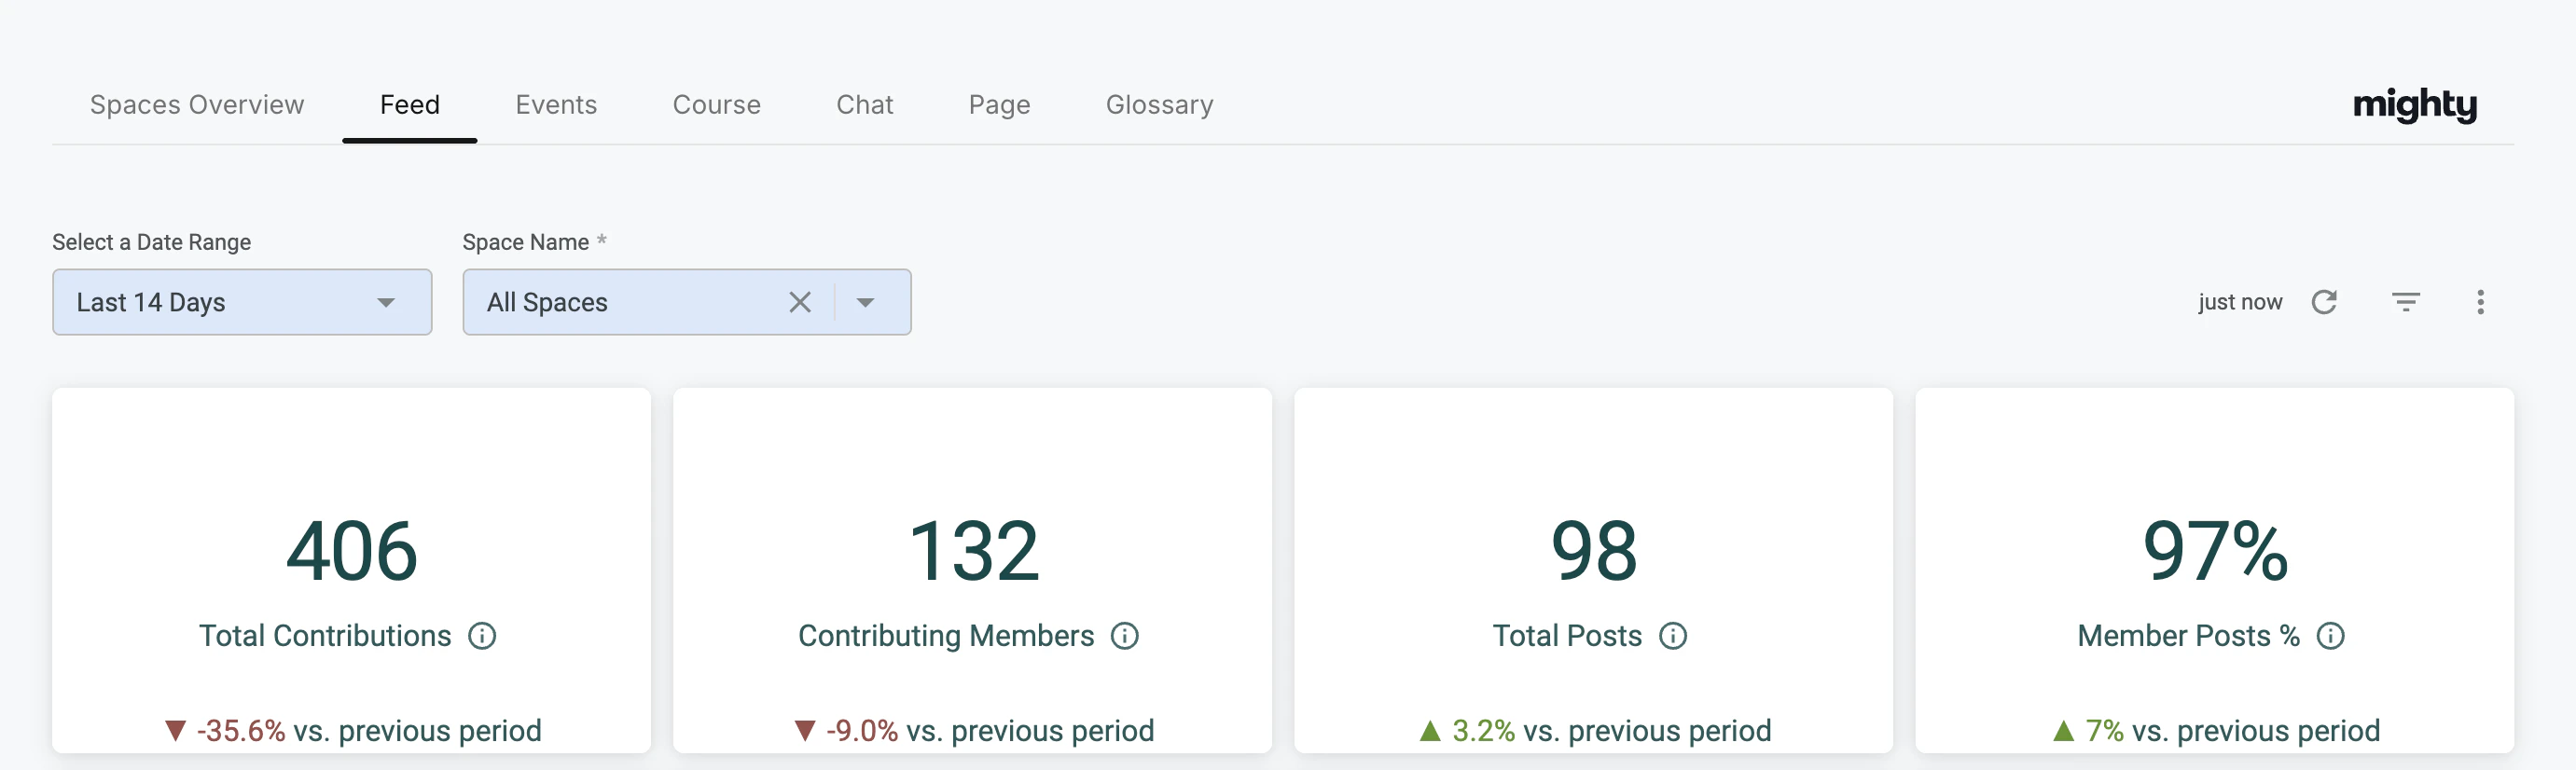
- Total Contributions: All posts and interactions from members and Hosts. This reflects overall engagement across your Mighty Network.
- Contributing Members: The number of members who contributed posts or interactions.
- Total Posts: The total number of posts created.
- % Member Posts: The percentage of posts created by members compared to Hosts.
- Feed Contributions: A breakdown of contributions within the Feed.
- Total Posts by Type: The volume of each post type (Quick Posts, Articles, Polls, Questions), showing content trends over time.
- Member Posts vs. Host Posts: A comparison of member-generated posts and Host-generated posts.
- Top Posts: A list of the posts with the highest engagement in the selected date range.
- Post Title
- Published Date
- Creator Name
- Network Role
- Post Type
- Space
- Post Clicks
- Total Contributions
- Comments
- Post Reactions
- Comment Reactions
- Votes
- Shares
- Lots of reactions but few comments may signal an opportunity to spark more conversation.
- If certain content types (like polls) drive higher engagement—even if you don’t post them often—you may want to include more of them in your content mix.
Events
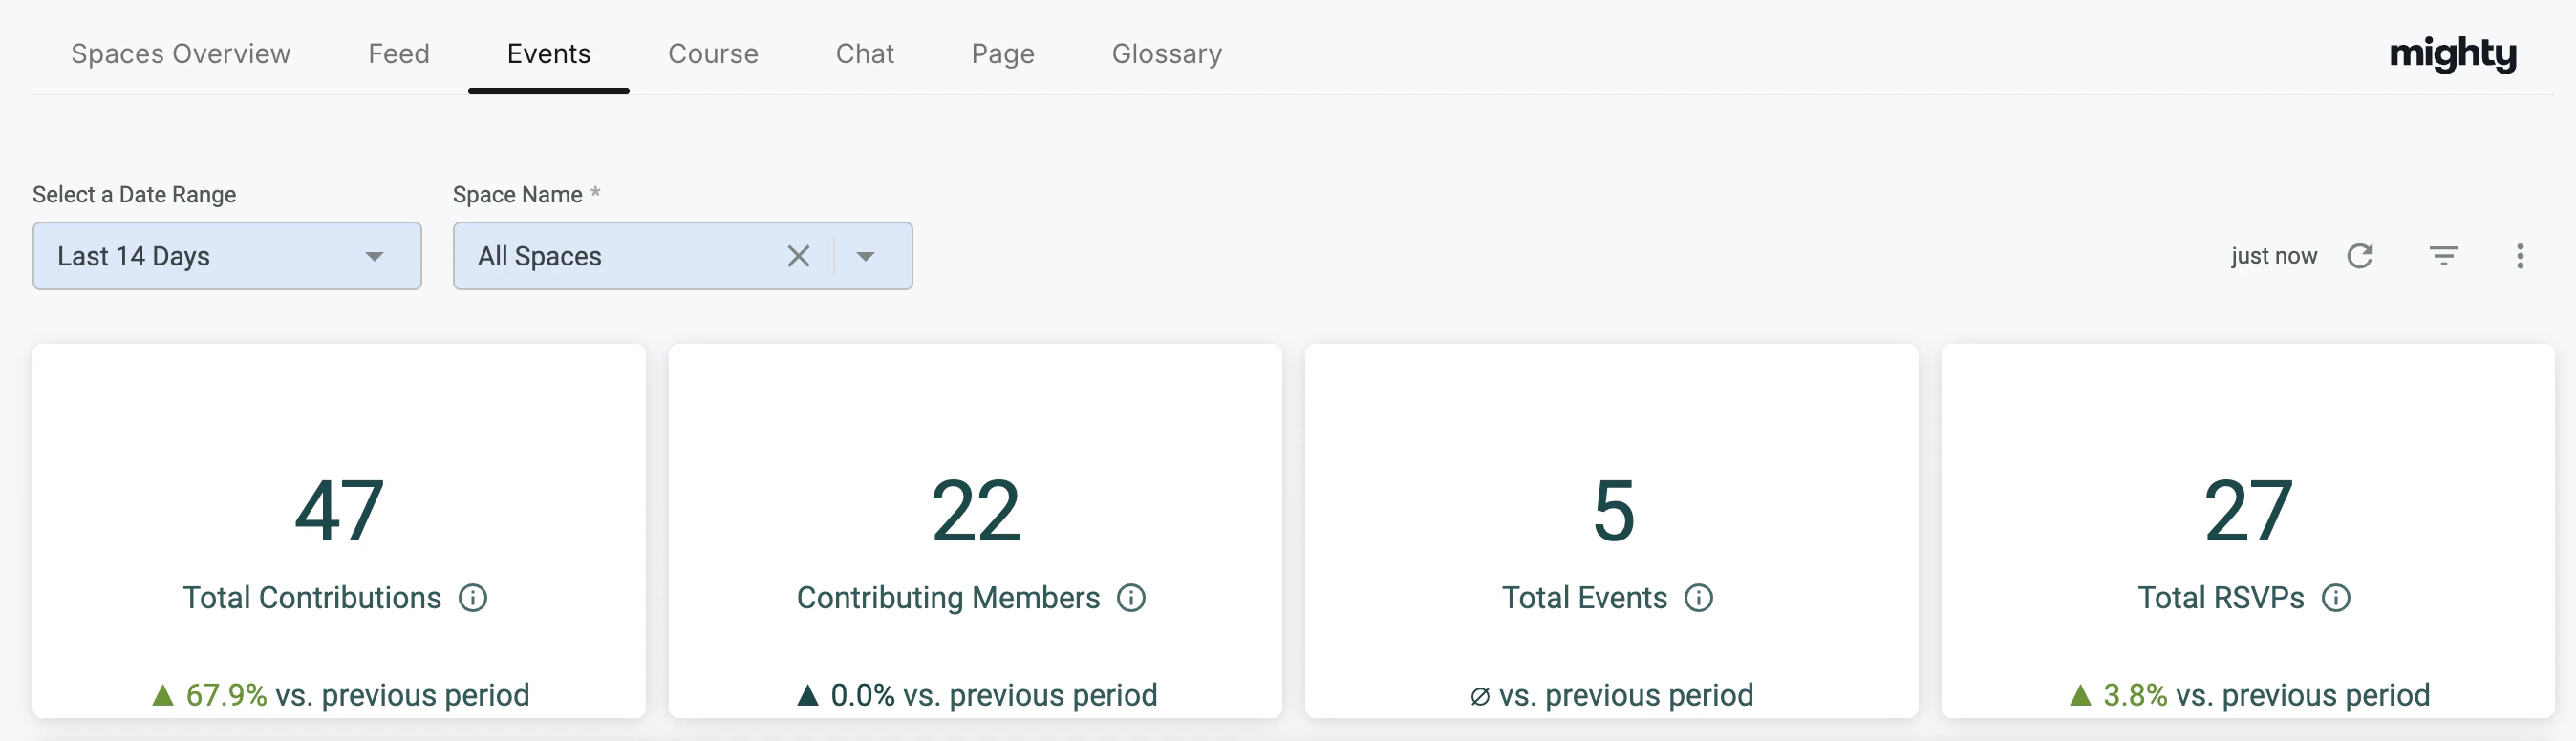
- Total Contributions
- Contributing Members
- Total Events
- Total RSVPs
- Space the event is in
- Creator Name
- Role
- Event Clicks
- Total Contributions
- Comments
- Reactions
- RSVPs
- Shares
Course
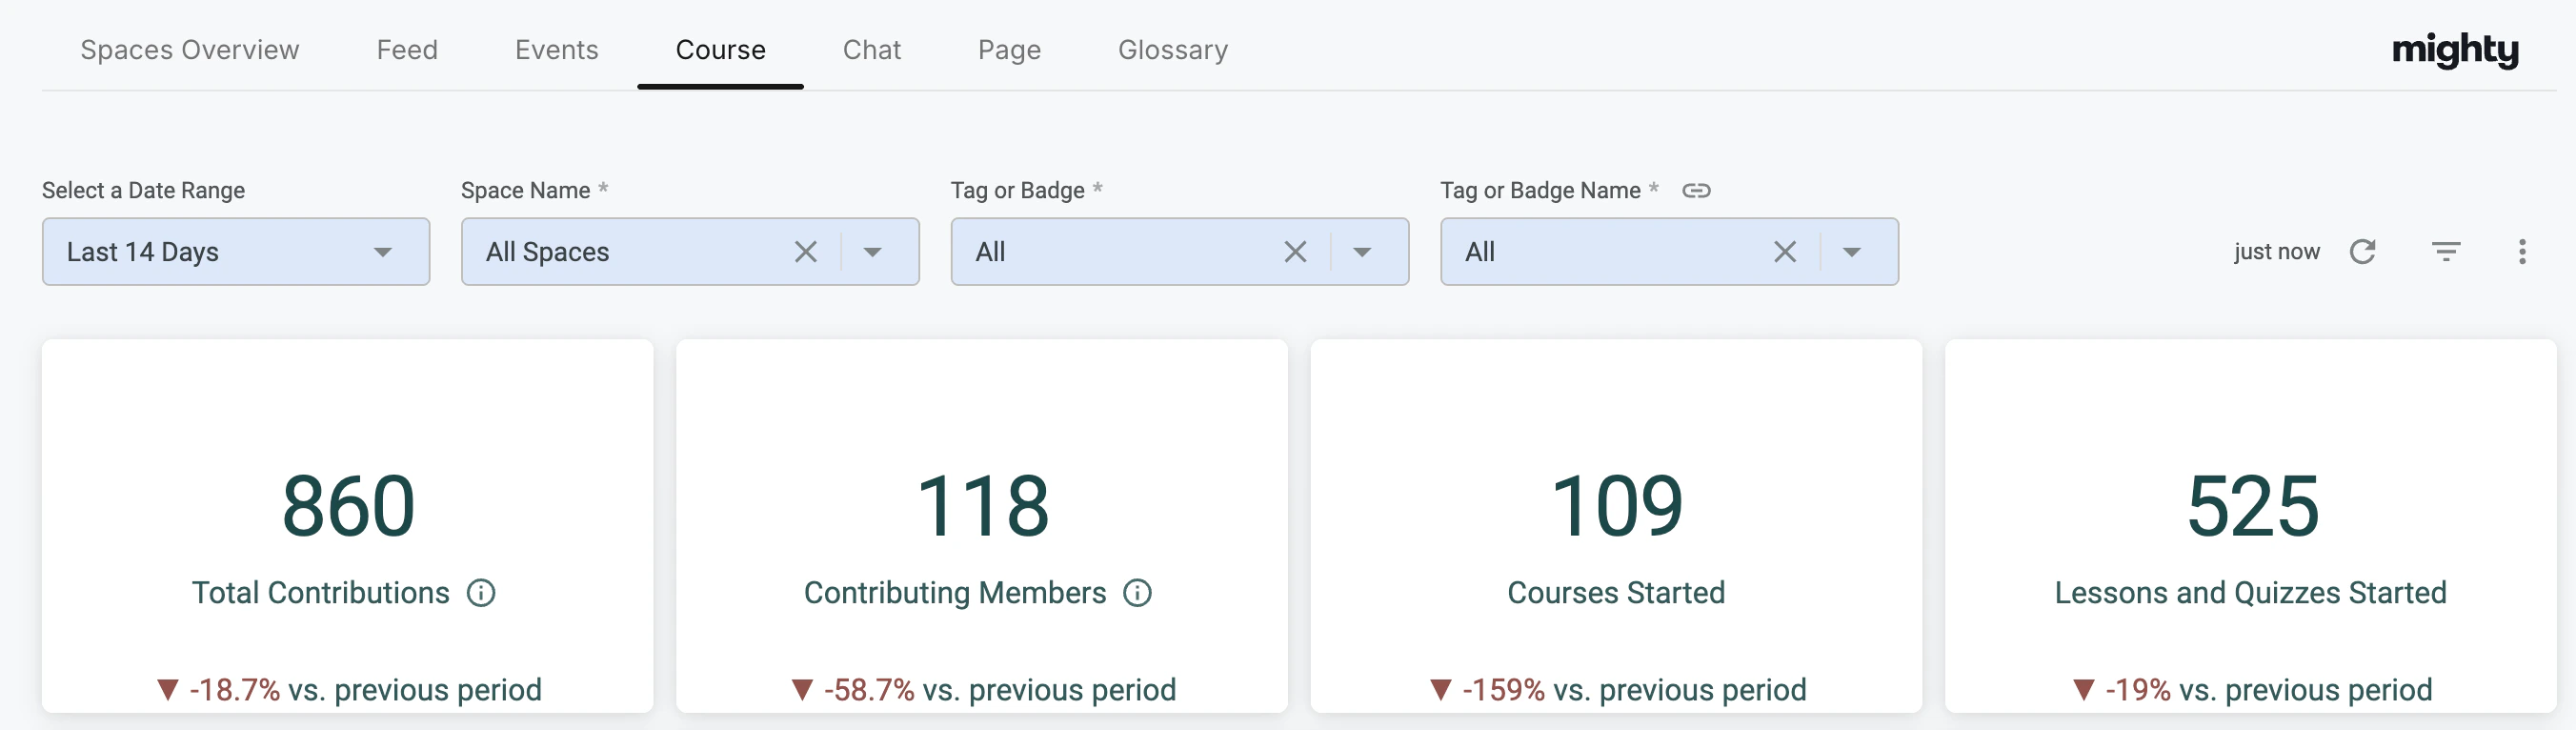
- Course Contributions
- Course Interactions
- Member Interactions
- Course Completion
- Lesson Completion
- Quiz Completion
- Member Progress
- Date Range
- Space Name
- Tag or Badge
- Tag or Badge Name
- Course Completion: Shows overall member progress for any Space with a Course. This includes tracked Lessons and Quizzes with completion settings enabled.
- Lesson Completion: Shows member progress for each Lesson, sorted in the order Lessons appear in your Mighty Network.
- Quiz Completion: Shows member progress for each Quiz, sorted in the order Quizzes appear in your Mighty Network.
- A Lesson Progress table
- A Quiz Progress table
Chat
This dashboard includes data similar to your Direct Messages dashboard, but specifically for the Space Chat feature.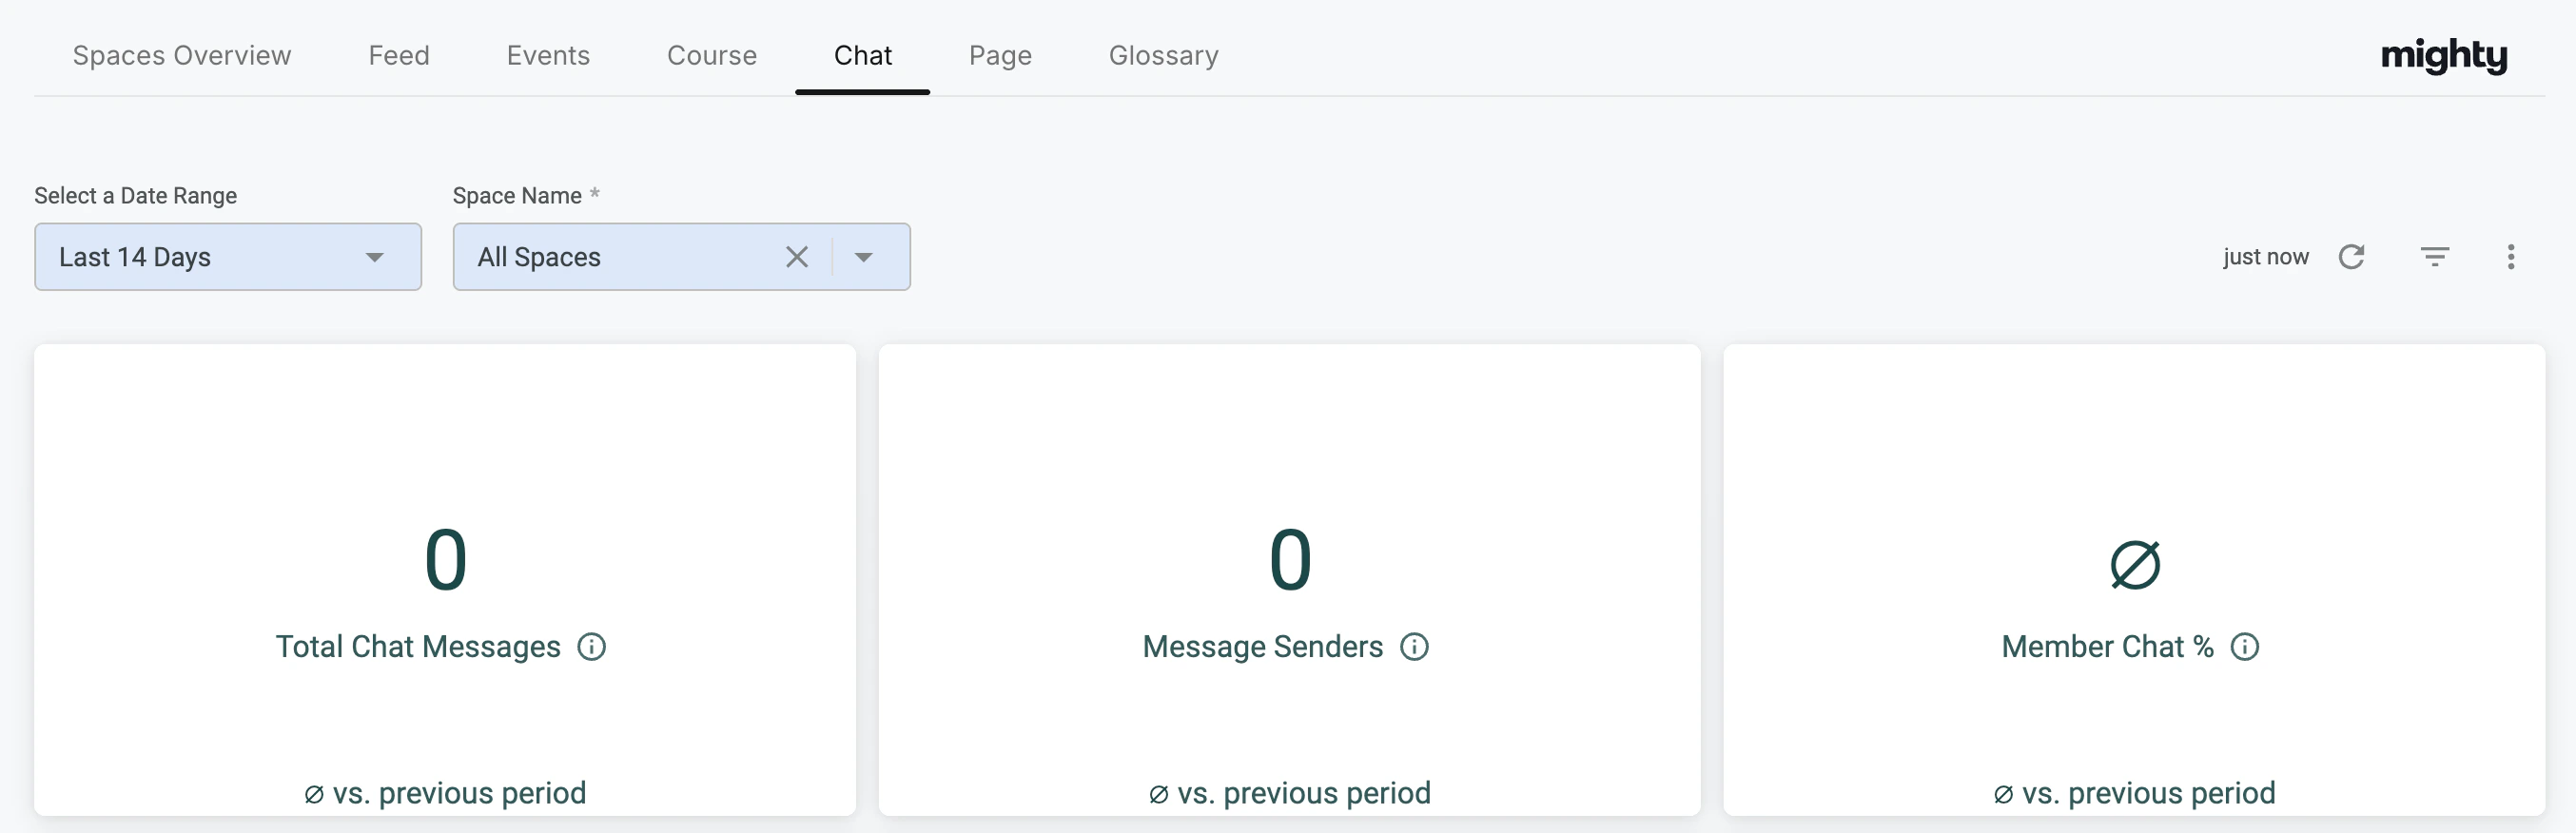
- Total Chat Messages
- Message Senders
- % of Direct Messages Sent per Platformpri
- Top 50 Direct Message Senders
Page
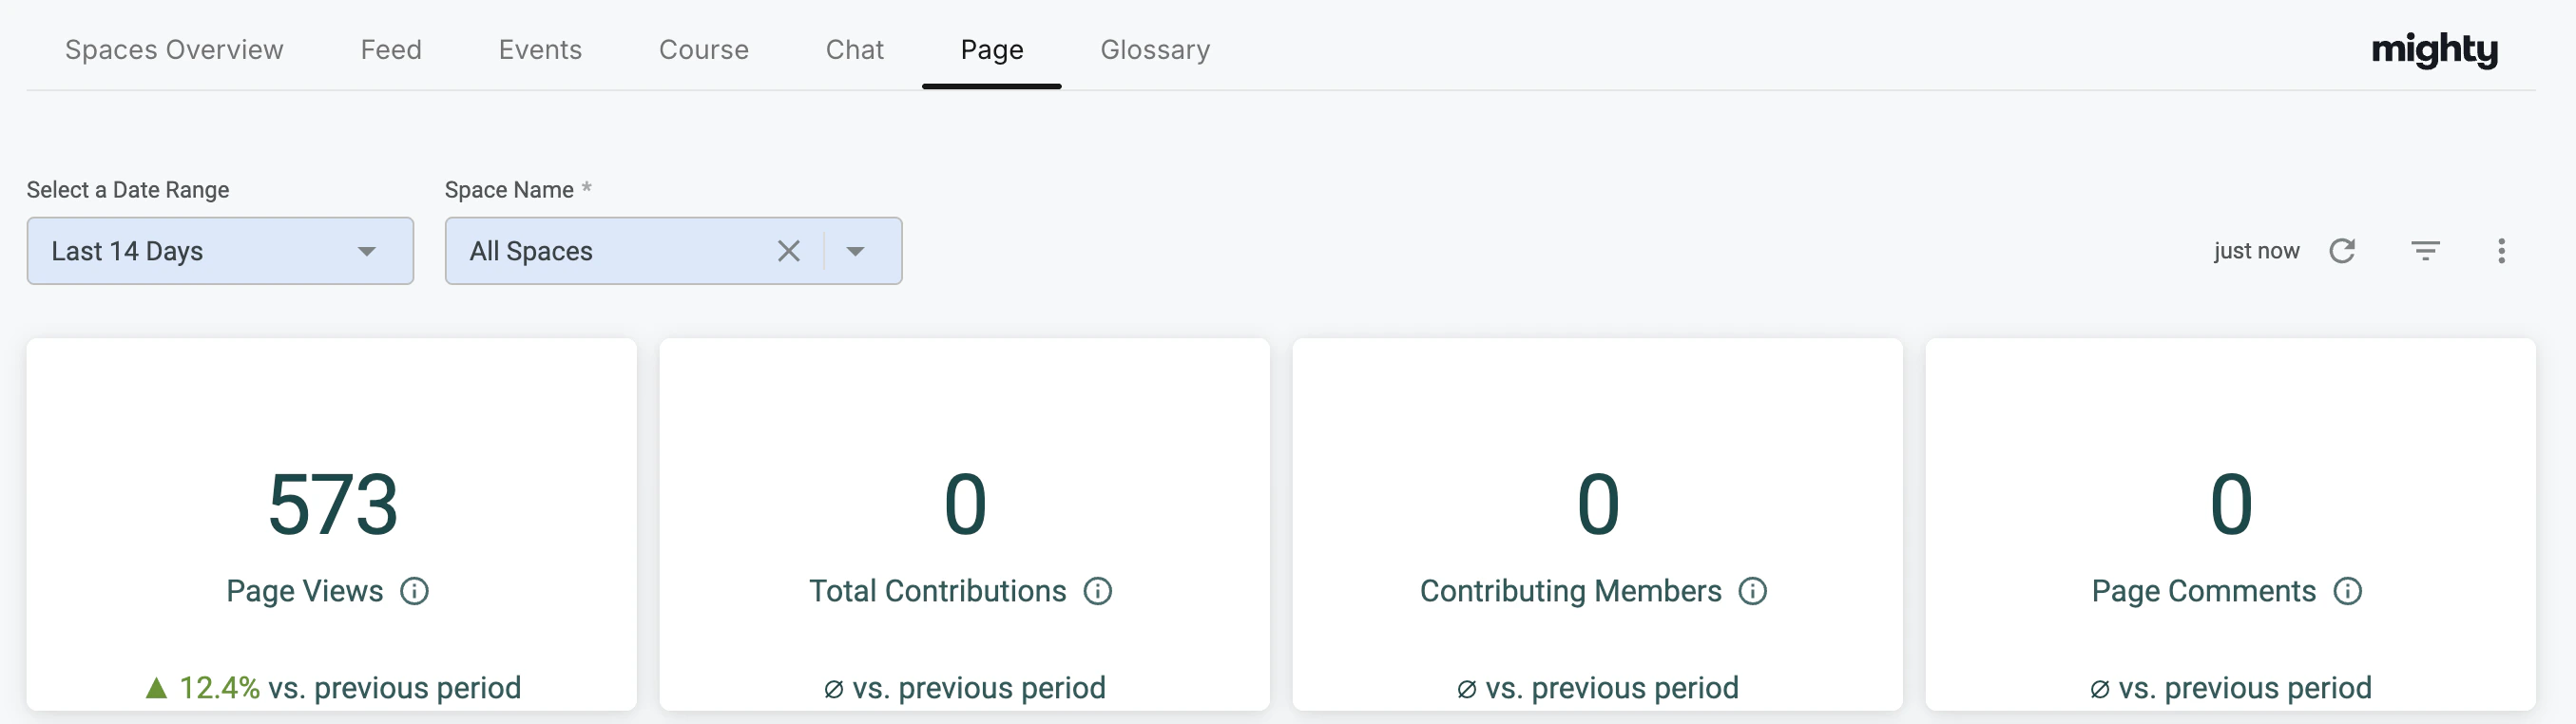
- Total Contributions
- Contributing Members
- Page Comments
- Page Views
- Page Title
- Space
- Page Views
- Total Contributions
- Comments
- Reactions
- Shares